GLEANER
HOW TO QUERY
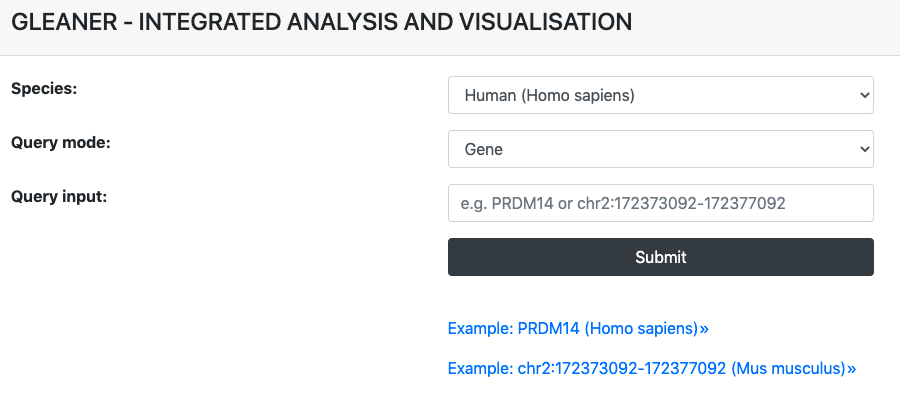
On the QUERY page, users can begin a query by inputting a gene name or a genomic region to get its transcriptional and epigenetic dynamic features in the germline cycle by giving:
- Species: human or mouse
- Query mode: gene or genomic region
- Query input: gene (RefSeq ID or Gene Symbol) or genomic region (in the format of "chromosome:start-end")
All options above are required to be provided to begin a query in GLEANER.
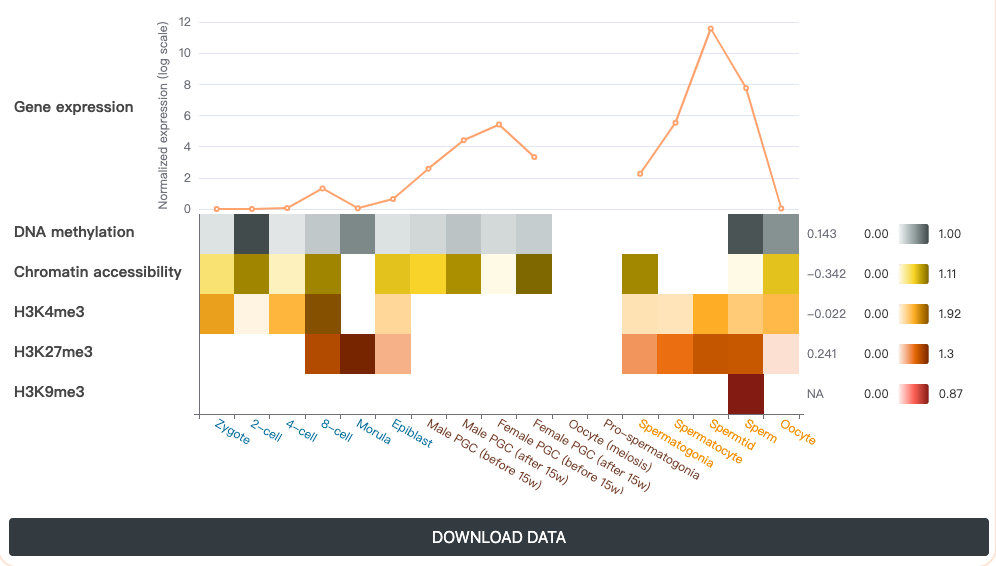
Users can get concise outputs containing three modules by providing their a gene or a genomic region.
- Integrative transcriptional and epigenetic features are demonstrated using a line plot and a heatmap, in which the Pearson correlation coefficient (PCC) between transcriptional and epigenetic features in each phase and the germline cycle are displayed, respectively. Besides, by clicking the DOWNLOAD button, users could obtain the transcriptional and epigenetic feature measurements of the query gene in tab-separated format.
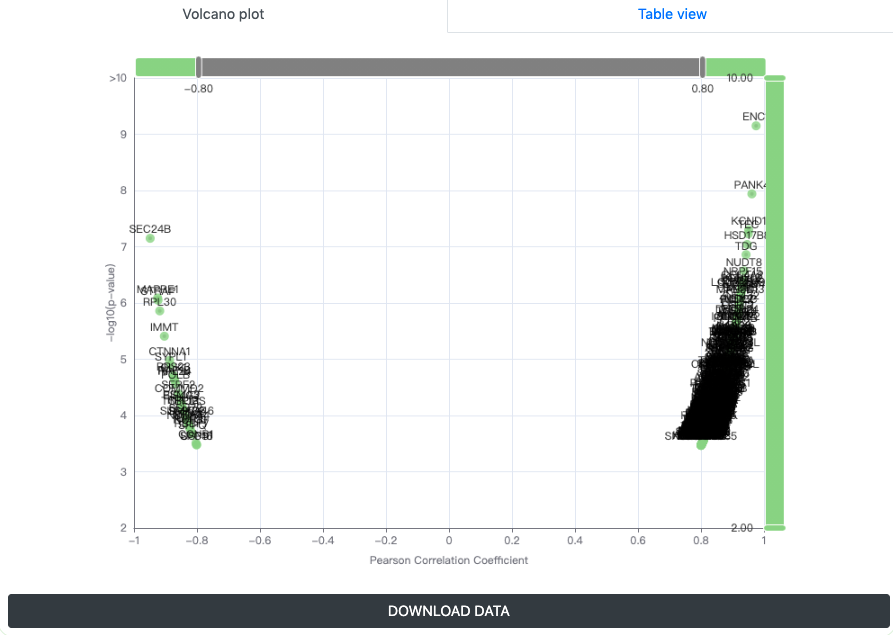
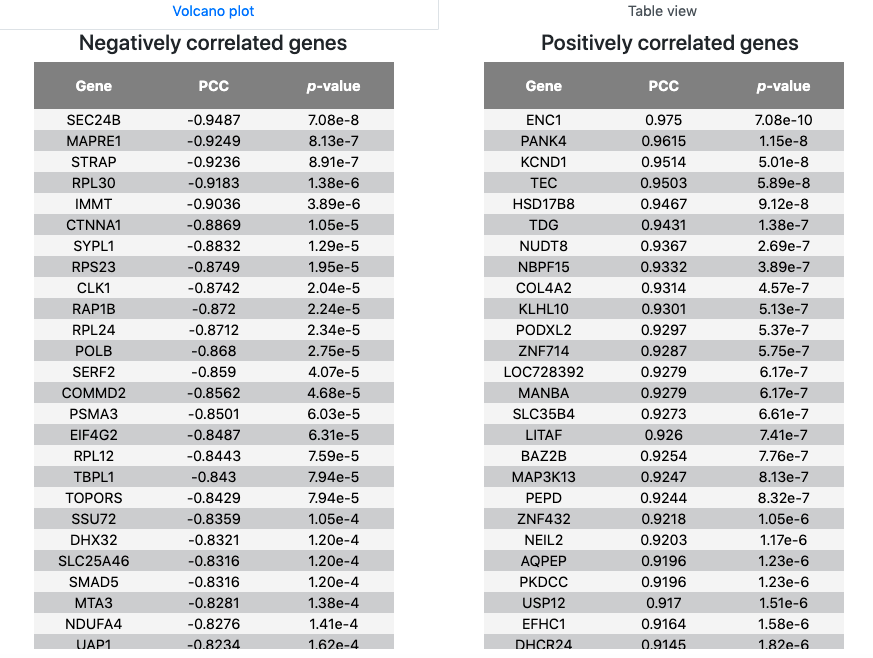
- Correlated changing genes correlation were displayed as a volcano plot. With PCCs and p-value thresholds, users can select the significant positively and negatively correlated candidates with input. By clicking the DOWNLOAD button, users could obtain the transcriptional positive and negative correlation gene information of the query gene in tab-separated format.
- Correlated changing genes positive and negative correlation information were also provided as table views, respectively, which contained gene name, PCC and p-value.
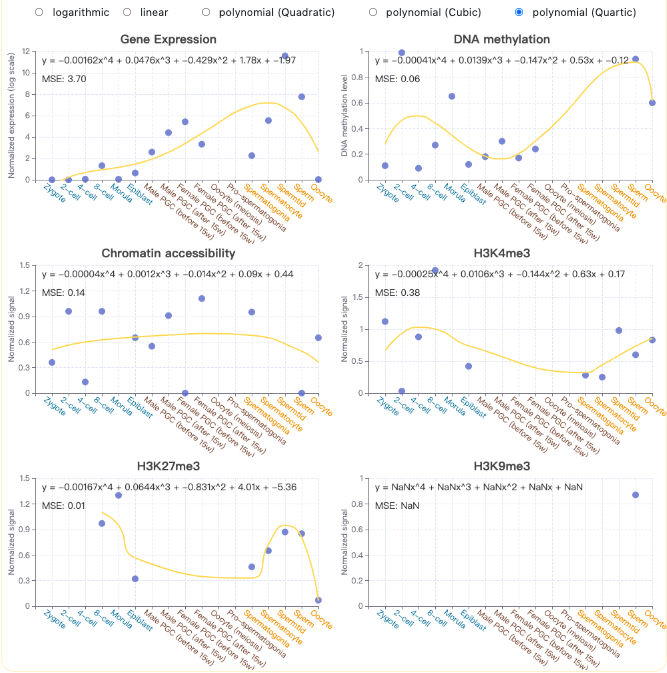
- Overall continuous change trends of transcriptional and epigenetic features on the different stages of germline cycle were fitted with different optional regression models, which included linear model, logarithmic model and polynomial (quadratic, cubic and quartic) model, and displayed as line form to include the features in uncharacterized intermediate development stages.
HOW TO QUERY GENES IN CLUSTERS
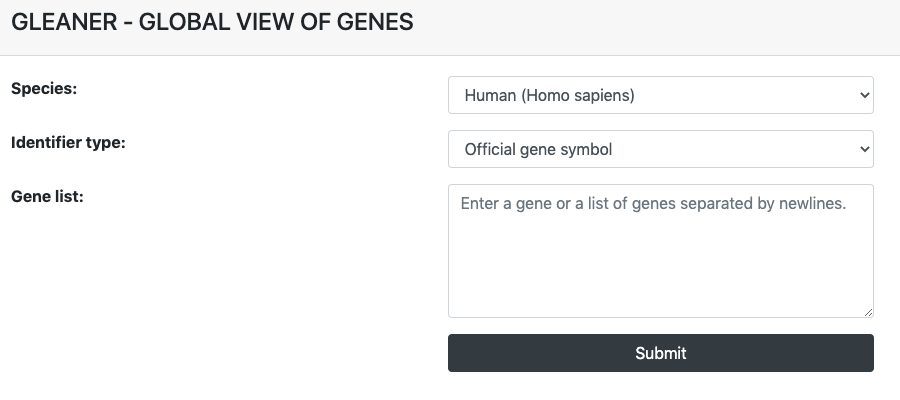
On the CLUSTER page, users can begin a query by inputting a gene list in line break separated format to get clustering information of the their transcriptional and epigenetic features in the germline cycle by giving:
- Species: human or mouse
- Identifier type: Official gene symbol or Refseq ID
- Query input: a gene or a gene list separated by line breaks
All options above are required to be provided to begin a query in GLEANER.
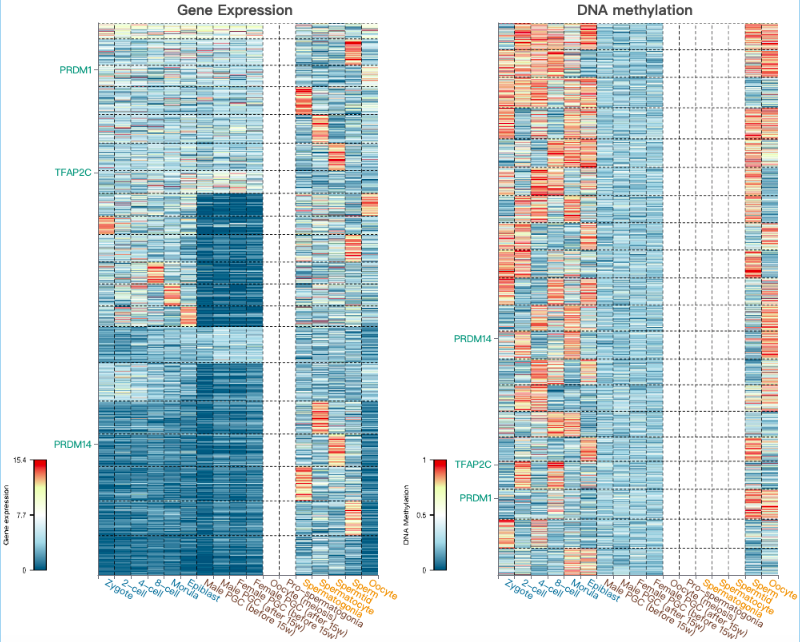
Users can get outputs containing clustering heatmaps of transcriptional and epigenetic features with highlighted positions of genes in queried gene list.
HOW TO EXPLORE THE DATA
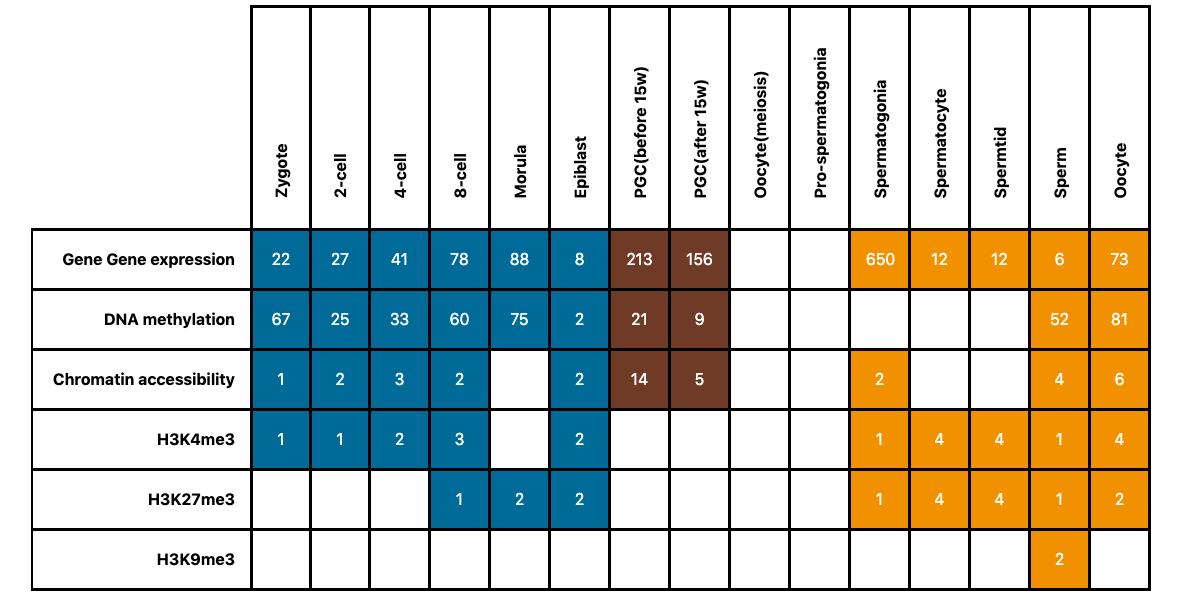
On the DATA page, users can easily get overview information of the human and mouse germline cycle. In the data description table, Each row represents the type of multiomics data, including gene expression, DNA methylation, chromatin accessibility, and histone modification characteristics H3K4me3, H3K27me3 and H3K9me3. Each column represents the developmental stage of the germline cycle, which contains three major phases: preimplantation embryogenesis (blue), PGC development of postimplantation embryos (brown) and gametogenesis of after-birth individuals (orange). Numbers of table cells represent the sample number of each data type at each stage in the germline cycle. Blank table cells represent missing data.
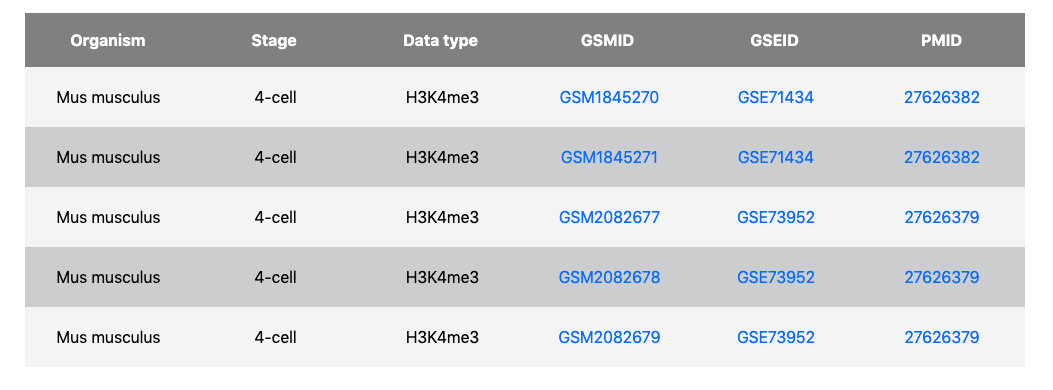
By clicking each cell, a summarized table about sample information of distinct data type and development stage will display, which includes:
- Data type
- Development stage
- Sample name
- GSE & GSM accession number
- Related citation title & PMID
External links of accession number in GEO and reference in PubMed are provided to users, respectively. All integrative data matrixes of different cell types are downloadable on the DATA page of GLEANER.