GLEANER
OVERVIEW
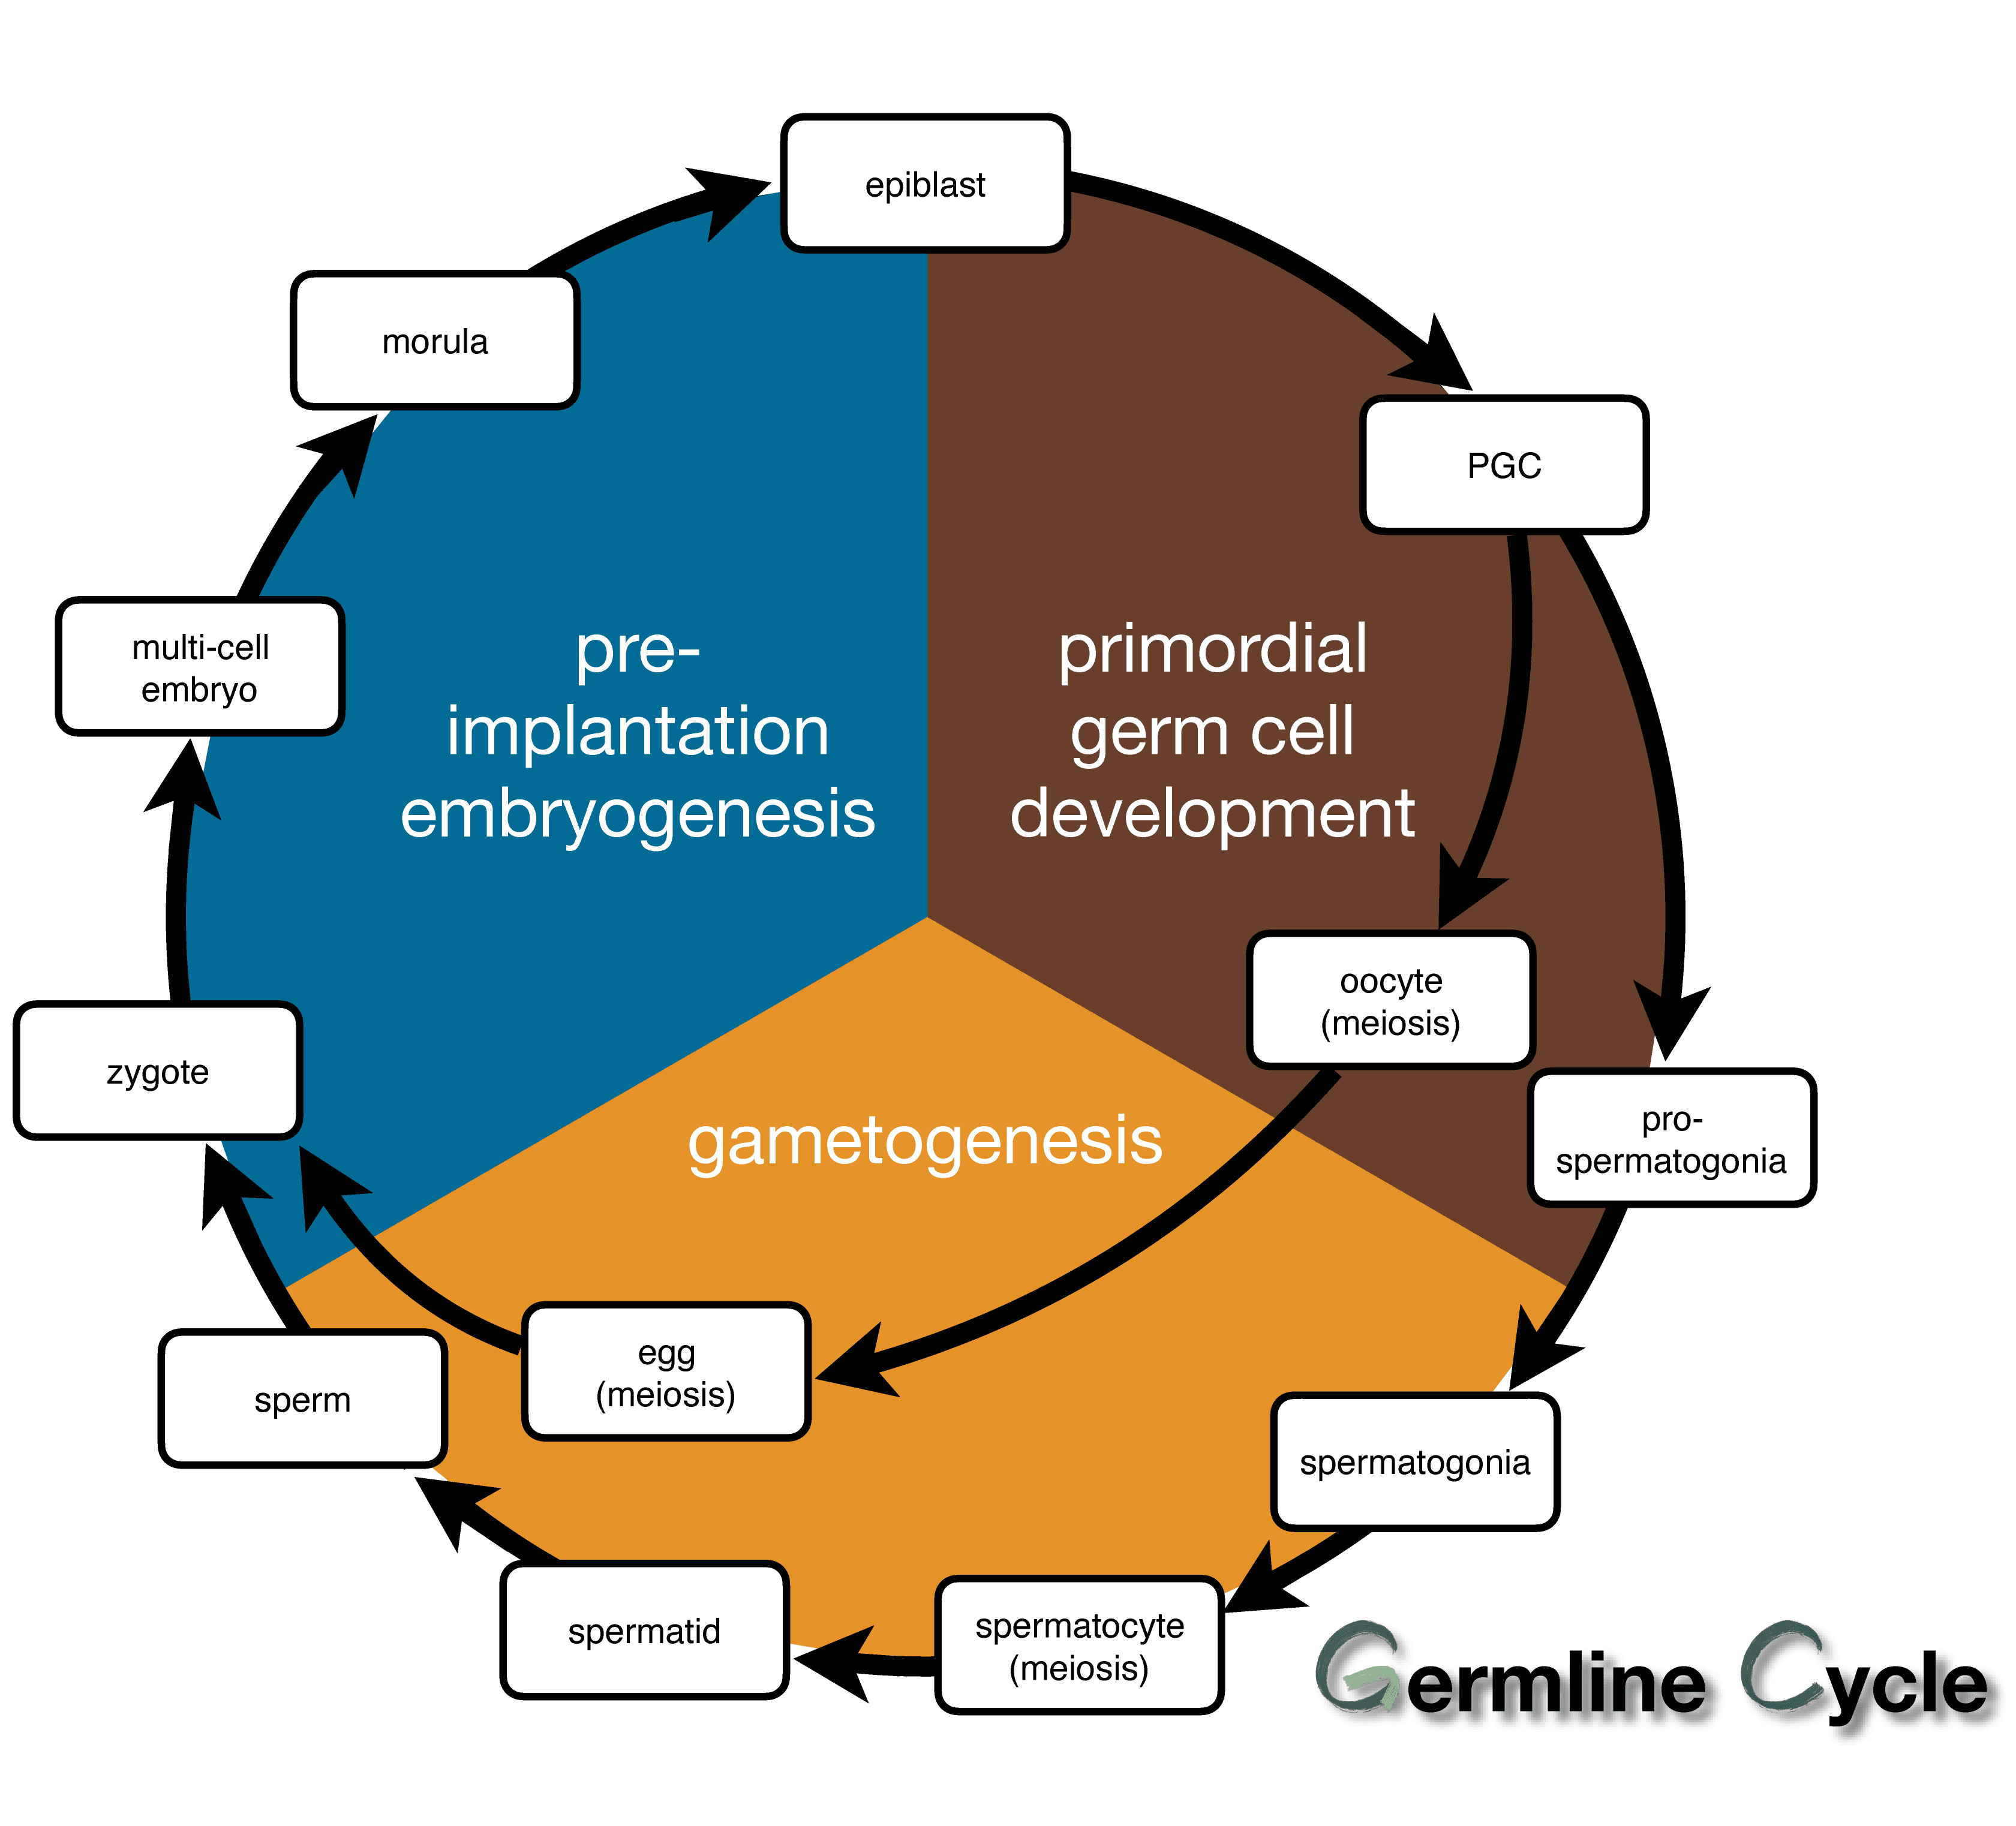
In mammals, genetic and epigenetic information is transmitted across generations through the germline cell development cycle (i.e., germline cycle).The germline cycle runs through the whole process of ontogenesis and contains three phases:
- the phase of preimplantation embryogenesis
- the phase of primordial germ cell (PGC) development in postimplantation embryos
- the phase of gametogenesis in individuals after birth
In the past decade, studies that characterized the dynamics of transcriptional and epigenetic features reported the local relationships of these dynamics at different phases of the mammalian germline cycle by using high-throughput sequencing technologies. For example, in the preimplantation embryogenesis phase of the mouse germline cycle, Liu et al. reported that transcriptional activation is related to increasing H3K4me3 distribution in gene promoter regions. In the PGC development phase of the mouse germline cycle, Lesch et al. reported that the transcription activated epigenetic marker H3K4me3 was established and that the repressive epigenetic marker H3K27me3 was removed in the active gene promoters. Recent studies further proved the continuity of the germline cycle by linking adjacent phases; for example, it has been reported that global epigenetic reprogramming of the genome occurs during the preimplantation embryogenesis phase and early PGC development phase in the mammalian germline cycle. Both of these waves of epigenetic reprogramming result in a decrease in global DNA methylation along with epigenetic modification re-establishment to regulate transcription. However, these findings are still difficult to extend to the whole germline cycle to explain the inheritance and transmission of genetic information across generations due to the following two limitations.First, owing to the large time span of the germline cycle, previous studies profiled only the transcriptome and epigenome in one or two phases of the germline cycle and lacked an understanding of gene expression dynamics and epigenetic regulation during the whole germline cycle. Second, several important and rare cell types in the mammalian germline cycle (especially migrating PGCs in the early gestational stages in humans and mice and prospermatogonia and mitotic oocytes in the late gestational stage in humans) are difficult to collect and characterize, so transcriptome and epigenome profiles are usually incomplete, leading to a deficiency in continuous dynamic trends of the transcriptome and epigenome during the whole germline cycle.
Taking advantage of the continuity and integrality of the germline cycle, it is feasible to overcome these two limitations by integrating the existing transcriptional and epigenetic high-throughput sequencing data in the germline cycle and building an online web server that provides multiomics features, the genes with correlated changes in transcription and the overall continuous dynamic trends of the transcriptome and epigenome for an inputted gene.
Here, we present GLEANER, a web server for human and mouse germline cycle expression analysis and epigenetic roadmap visualization, which integrates and provides visualization of transcriptional and epigenetic features in the germline cycle. GLEANER is based on 1,764 transcriptomics samples, 600 DNA methylation samples, 86 samples characterized for chromatin accessibility and 171 samples characterized for histone modification (80 H3K4me3 samples, 71 H3K27me3 samples and 20 H3K9me3 samples) in the three phases of the human and mouse germline cycle. GLEANER takes a gene or a genomic region as input and reports the following outputs:
- integrated analysis of the transcriptional and epigenetic dynamics of the input element in the germline cycle;
- the genes whose transcriptional changes are most positively or negatively correlated with those of the input element, as well as the integrated data matrix download;
- overall continuous change trends of transcriptional and epigenetic features at the different stages of germline cycle, including the uncharacterized intermediate cell stages.
MATERIALS AND METHODS
Data collection and preprocessing
The high-throughput sequencing datasets characterized typical omics (i.e., transcriptomics, epigenomics of DNA methylation, chromatin accessibility and three types of histone modifications) in mouse and human germline cycle are collected from a public database (Gene Expression Omnibus, GEO). To represent and investigate the transcriptional regulatory effects of epigenetic modifications, we focused on the gene promoter regions, defined as those regions -2,000 base pairs (bp) and +500 bp around the transcription start sites. For these datasets with preprocessed data available, the preprocessed expression levels or the signals of epigenetic features were adopted. For those datasets that had only raw data available, raw reads were first trimmed using TrimGalore and then mapped to the reference genome (mm9 for mouse and hg19 for human). For RNA-seq data, the sequenced reads were mapped to the reference genome using TopHat (v2.1.1) with default parameters. To make the expressions comparable between different samples, expression levels were measured as TPM values. For BS-seq data, BSMAP was used to map the sequenced reads to the reference genome with parameters “-n 1 -r 0 -s 16” for WGBS data and parameters "-n 1 -r 0 -s 12 -D C-CGG" for RRBS data. The DNA methylation levels were quantified by using the mcall function in MOABS. For ChIP-seq and CUT&RUN data, sequenced reads were mapped to reference genome using bowtie2 with default parameter. The signals of epigenetic features were calculated from the piled-up reads using MACS with parameters "--SPMR", which generate profiling signal normalized to 1 million reads. For DNase-seq data and ATAC-seq data, bowtie2 was used to map the sequenced reads to the reference genome with default parameters. MACS pileup function was used to calculate the chromatin openness signal by using filtered fragments (less than 120bp) with "--extsize=50 --SPMR" to normalize signals to 1 million reads background. Transcriptional and epigenetic features from biological replicates were averaged for subsequent analysis. GLEANER also provides a visualized and downloadable page of these collected data including a data summary, the public accession numbers and the related publication information.
Data normalization
Samples from different researches may have batch effects. For different types of data, we used different strategies to eliminate the effects of different data sources or experimental batches. For the chromatin accessibility data and histone modification data, signal profiles were normalized per one million reads and calculated on genomic regions by using parameters "--SPMR" in MACS to control the sequencing depth to obtain relatively comparable values among different cell types. For DNA methylation data from BS-seq, due to the quantitative methylation levels calculation above, no more extra normalization processes were performed.
Correlated changing genes selection
To select the genes with correlated transcriptional changes, we calculated the Pearson correlation coefficient (PCC) and the correlation test p-value between genes based on the expression levels in the germline cycle. The correlation calculations were performed using the R package Hmisc. Genes with a p-value < 0.01 and a PCC > 0.8 were selected as the positively correlated candidates, and genes with a p-value < 0.01 and a PCC < -0.8 were selected as the negatively correlated candidates.
Regression model construction and overall continuous dynamic trend visualization
For each gene, different regression models, which included linear model, logarithmic model and polynomial (quadratic, cubic, and quartic) model, were constructed and implemented by the ECharts Statistics module using the gene expression level or the average epigenetic signals within the gene promoter. With these regression models and their specific parameters, the overall continuous dynamic trends of the input transcriptional level or epigenetic features among the developmental stages in the mammalian germline cycle were demonstrated. The mean square error of the predictions were calculated and displayed as a validity estimation measurement.
UPDATE LOG
» v1.2.0 05/21/2021
- Functionality added and data updated.
» v1.1.0 03/01/2021
- Bug fixed and language edited.
» v1.0.0 07/20/2020
- The first public release of GLEANER is now available.
CITATION
Please cite:
Zeng S, Hua Y, Zhang Y, Liu G, Zhao C: GLEANER: a web server for GermLine cycle Expression ANalysis and Epigenetic Roadmap visualization. BMC Bioinformatics 2021, 22(1):289.
CONTACT
zsy_tj1020[AT]hotmail.com