Quick Start
If users have a specific chromatin regulator (CR) they're interested in, they can restrict the CR name, species, cell line (or cell type, tissue) the ChIP-seq data involves (if not set, return all the ChIP-seq data of the CR) in the search menu, otherwise, they can survey the ChIP-seq data of CRs (devided into four categories: writer, eraser, reader and remodeler) dataset by dataset through the left menu.
In this section, we use PHF8 as an example to show how to use Cistrome CR.
Step 1 BACK TO TOP
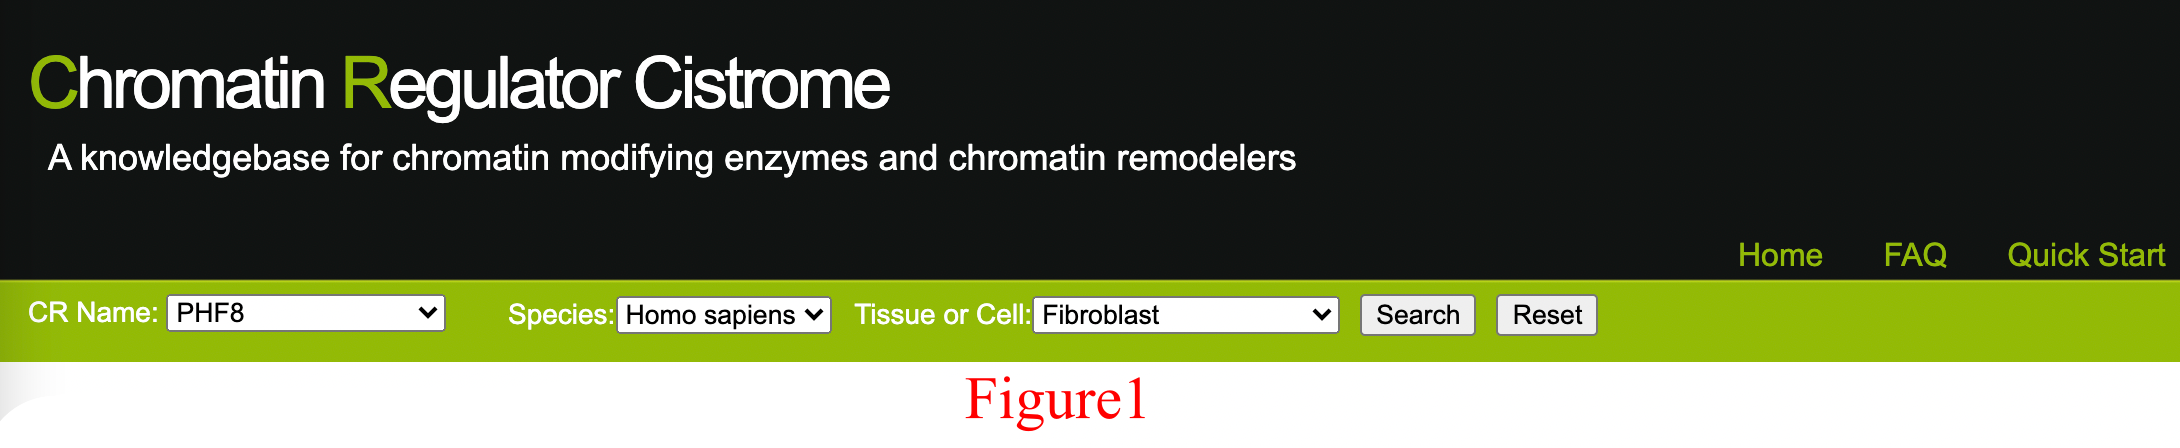
Assuming the user is interested in the ChIP-Seq data on PHF8 in human fibroblasts, they can select PHF8 in human fibroblasts in the search menu, as shown in Figure 1.
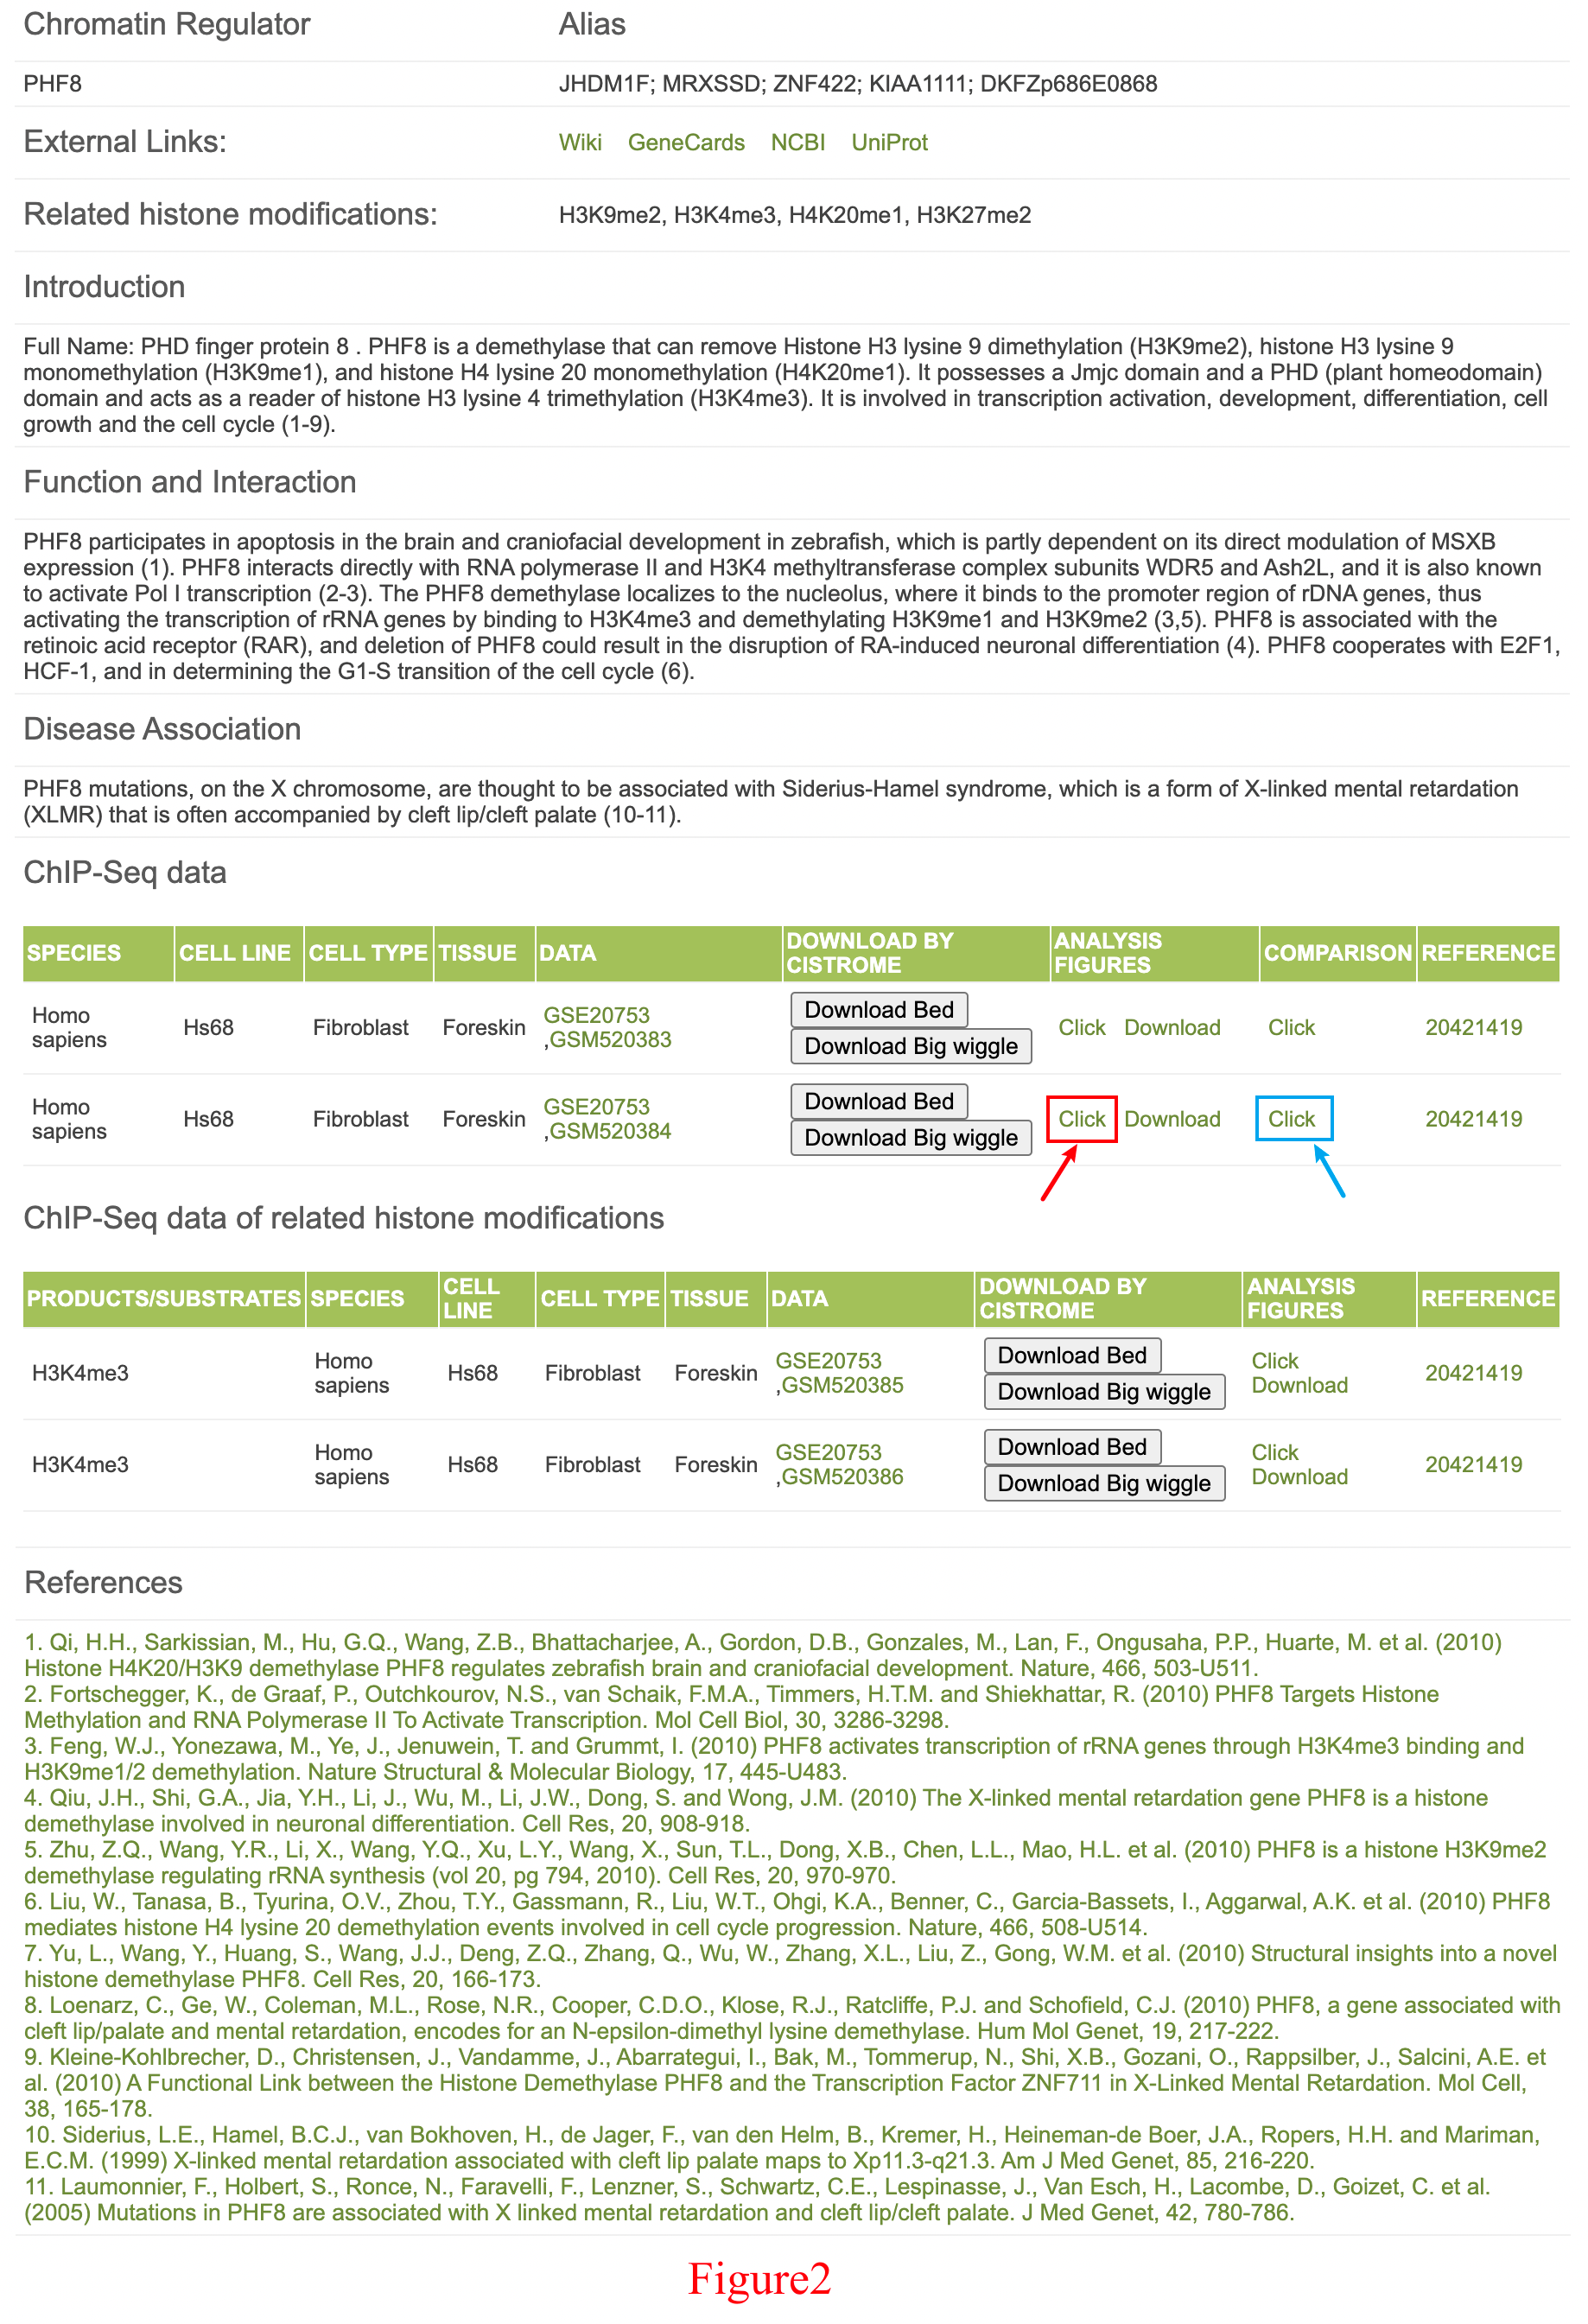
The database will then return a page containing the manually curated information for PHF8 as well as its ChIP-Seq data information and the related HM ChIP-Seq data information for fibroblasts (Figure 2). In fibroblasts, two PHF8 ChIP-Seq datasets are generated (GSE20753, GSM520383 and GSE20753, GSM520384), and the peak file (.bed), the read density file (.bw) and the analysis result are freely downloaded on this page. Users could also send the peak file and read density file to Galaxy/Cistrome (http://cistrome.org/ap/) for further analysis.
Step 2 BACK TO TOP
If the user wishes to acquire a detailed analysis of the result from the second ChIP-Seq dataset (GSE20753, GSM520384), they can follow the red arrow shown in Figure 2.
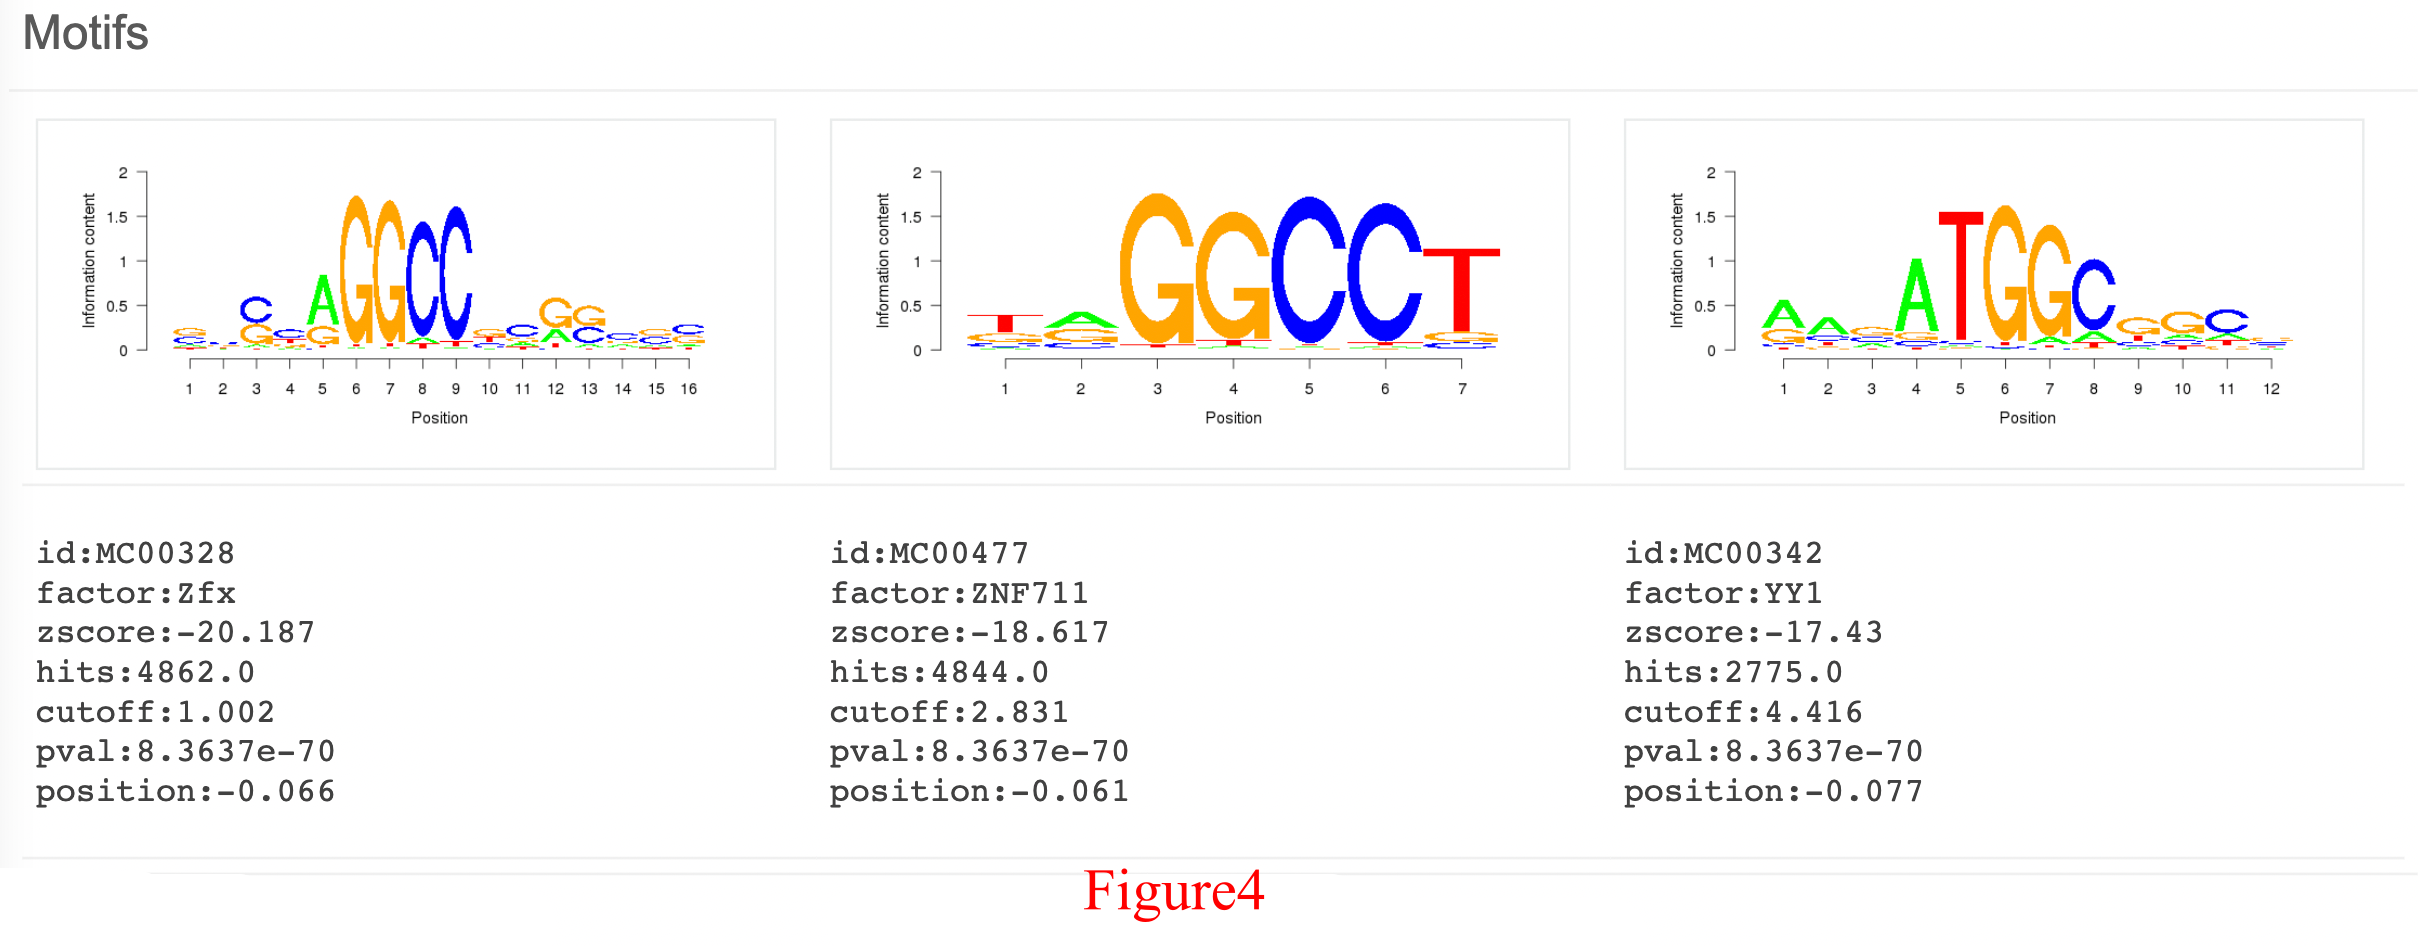
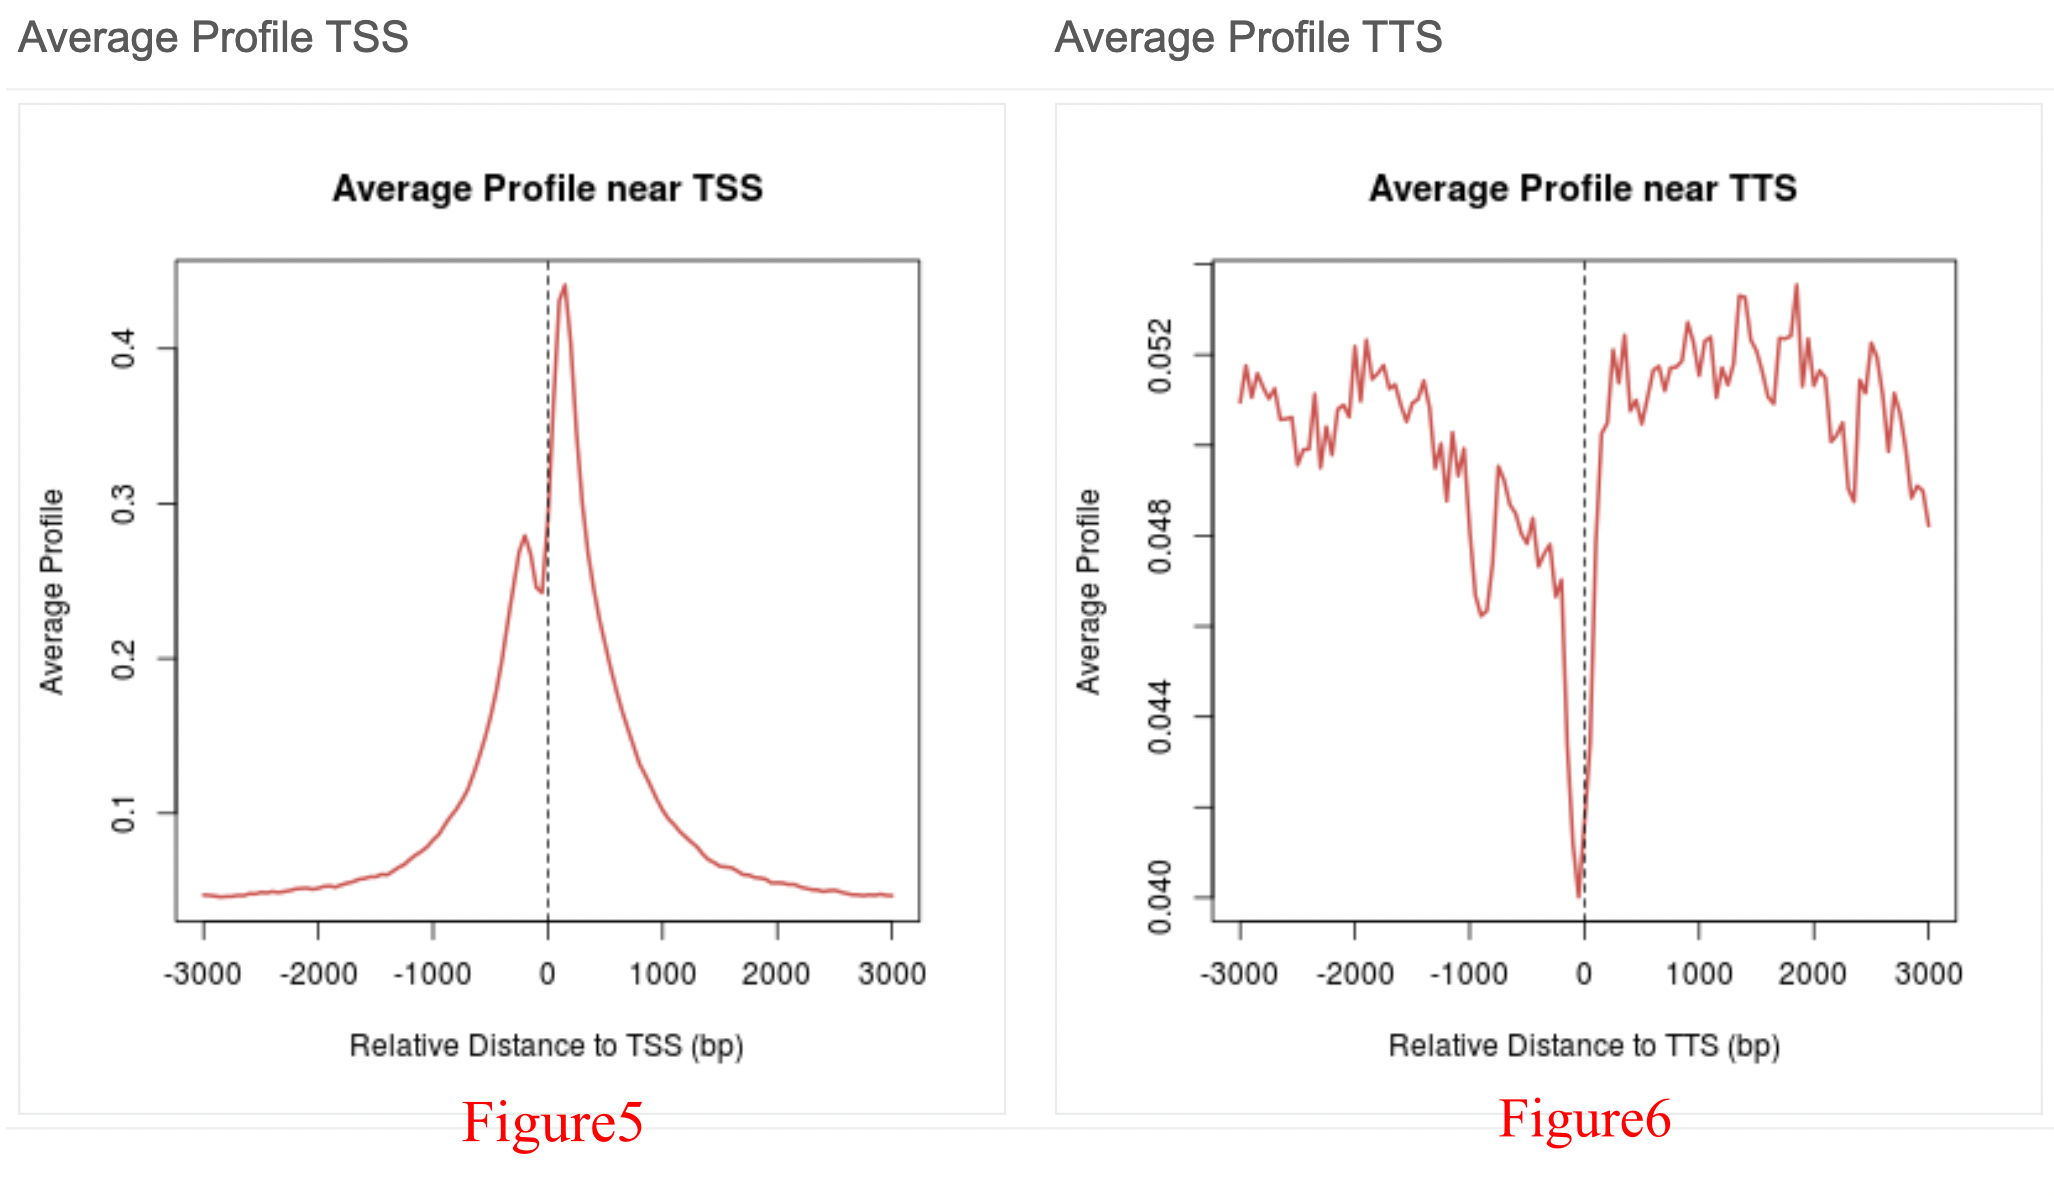
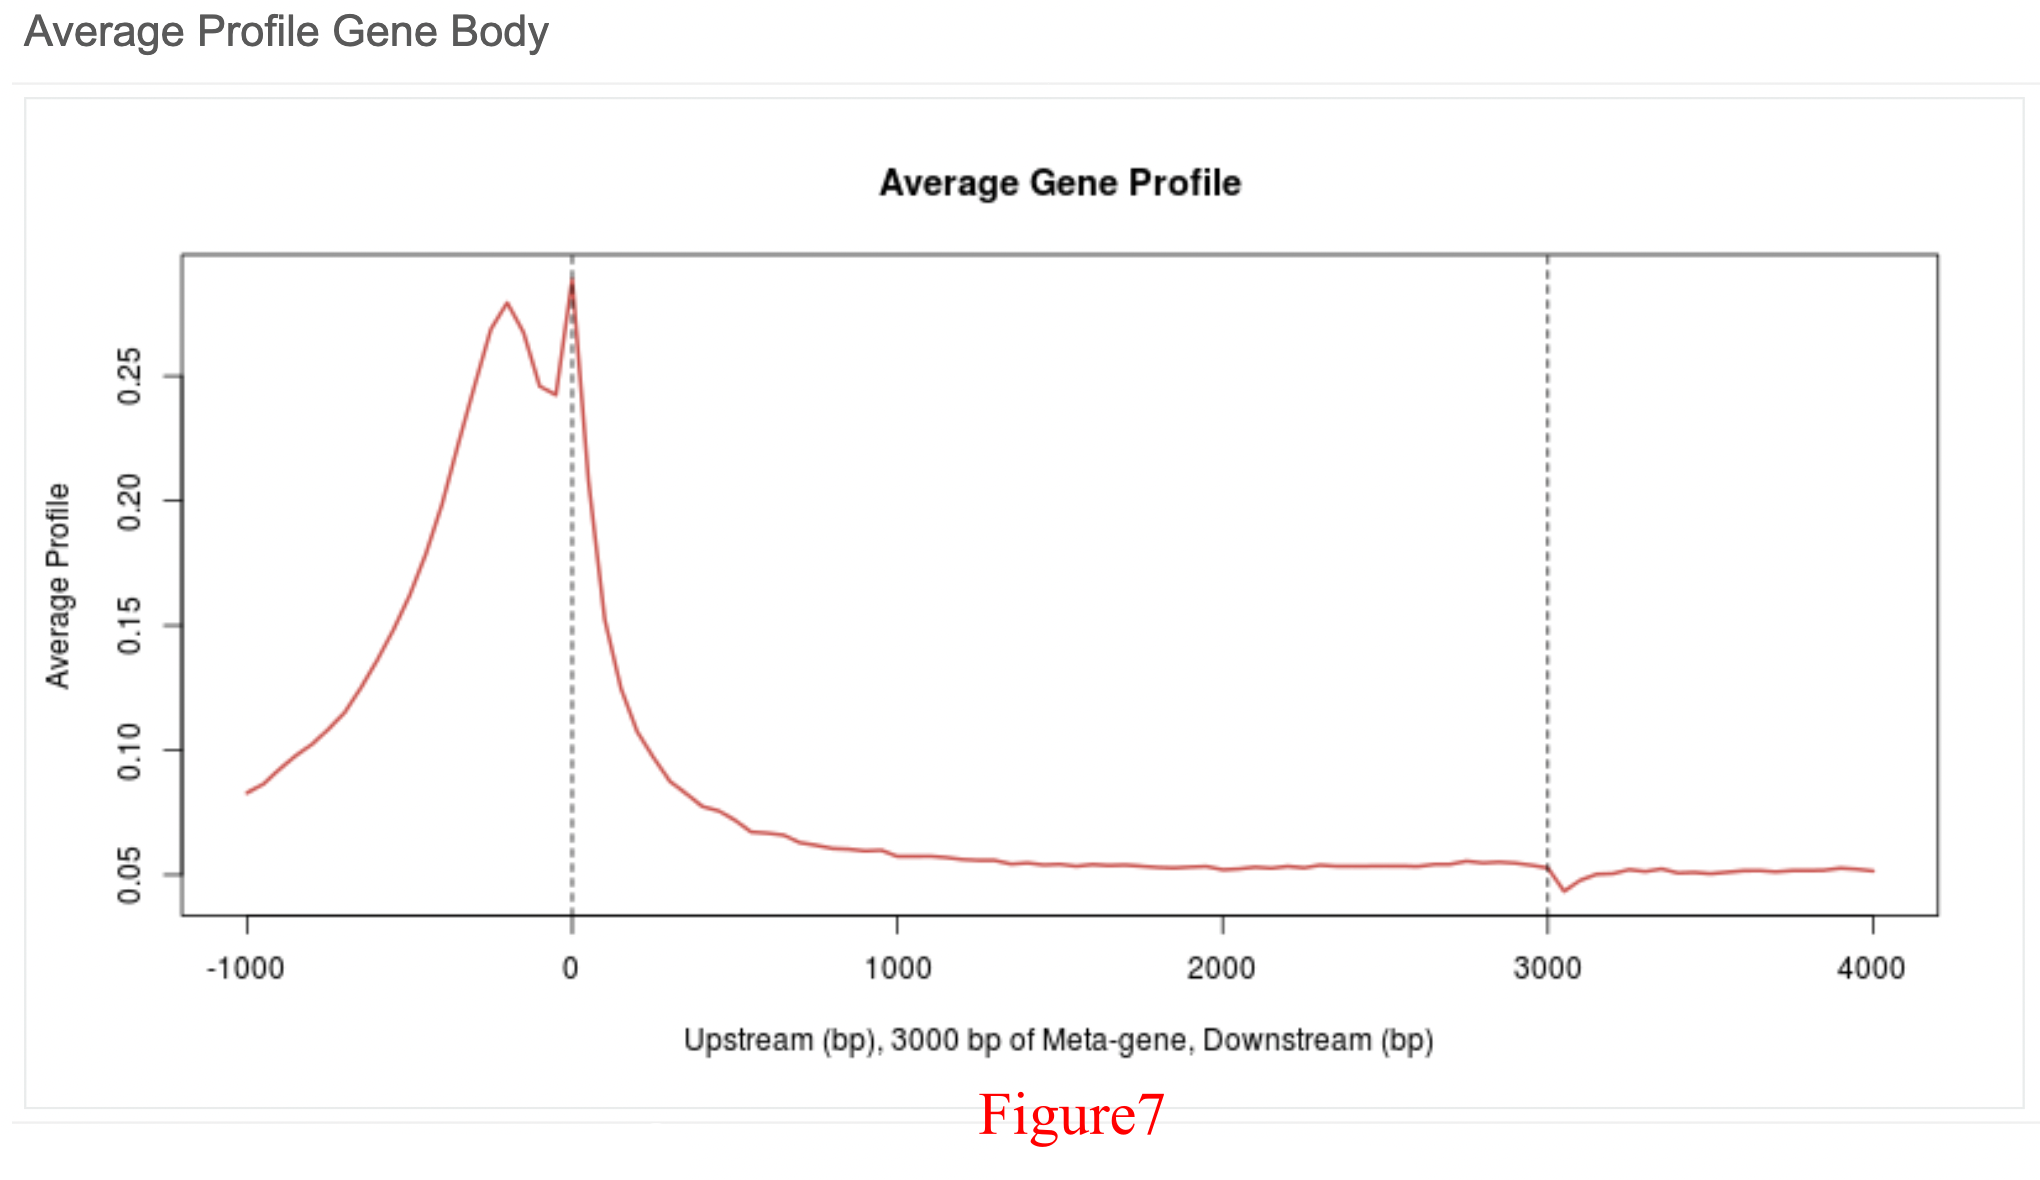
This action will provide a page containing the following analysis results: (1) a brief summary of this PHF8 dataset (Figure 3); (2) the top 3 enriched DNA-binding motifs in the genome region of PHF8 in fibroblasts (Figure 4); (3) the average ChIP-Seq signal profile near the TSS (Figure 5), the TTS (Figure 6), and across the gene body (Figure 7); (4) the genomic distribution of PHF8 ChIP-Seq peaks (Figure 8); and (5) the average conservation profile across PHF8 ChIP-Seq peaks (Figure 9).
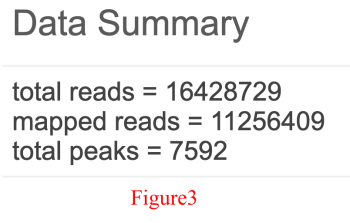
Figure 3 is a brief summary of this PHF8 raw ChIP-Seq. Here, "total reads" means all of reads sequenced in a single ChIP-Seq experiment, which indicates the resolution, while "mappable reads" means reads that align to the genomes with 2 mismatches allowed at most. Next, the mappable reads are employed to find the peaks using MACS. "Total peaks" means the number of regions in which the factor is enriched under the cutoff Q-value (0.01). Here, this PHF8 dataset includes 60,379,420 total reads, 33,694,178 mappable reads and 5,128 total peaks, suggesting that this dataset is of good quality.
Figure 4 shows the top three motif detection results, including the sequence logo, the z-score, and the factor name and position. In this case, additional factor (BRF1, BDP1 and ZNF711) motifs were enriched in the top 1,000 peaks obtained for PHF8, suggesting that there may be co-binding between them. And hyperlinks of the motif factors to transcription factor encyclopedia (TFe) were provided for further acquiring information including expression.
The profile near the TSS/TTS (Figure 5/Figure 6) focuses on the 3,000 bp (base pair) upstream and downstream of the TSS (TTS), while the average profile across the gene body (Figure 7) focuses on the 1,000 bp upstream of the TSS and 1,000 bp downstream of the TTS (all meta genes were divided into 3,000 bins). Here, there is a strong peak that can be viewed near the TSS, indicating that PHF8 is enriched and exhibits functions in fibroblast promoter regions.
The orange bar in Figure 8 represents the genomic distribution of PHF8 ChIP-Seq peaks, including the following five regions: the promoter, downstream, coding exon, intron, and distal intergenic regions. Based on comparison with the genomic distribution generated by chance (the blue bar), we can see that PHF8 is clearly enriched in the promoter region, which is consistent with the average ChIP profile near the TSS (Figure 5).
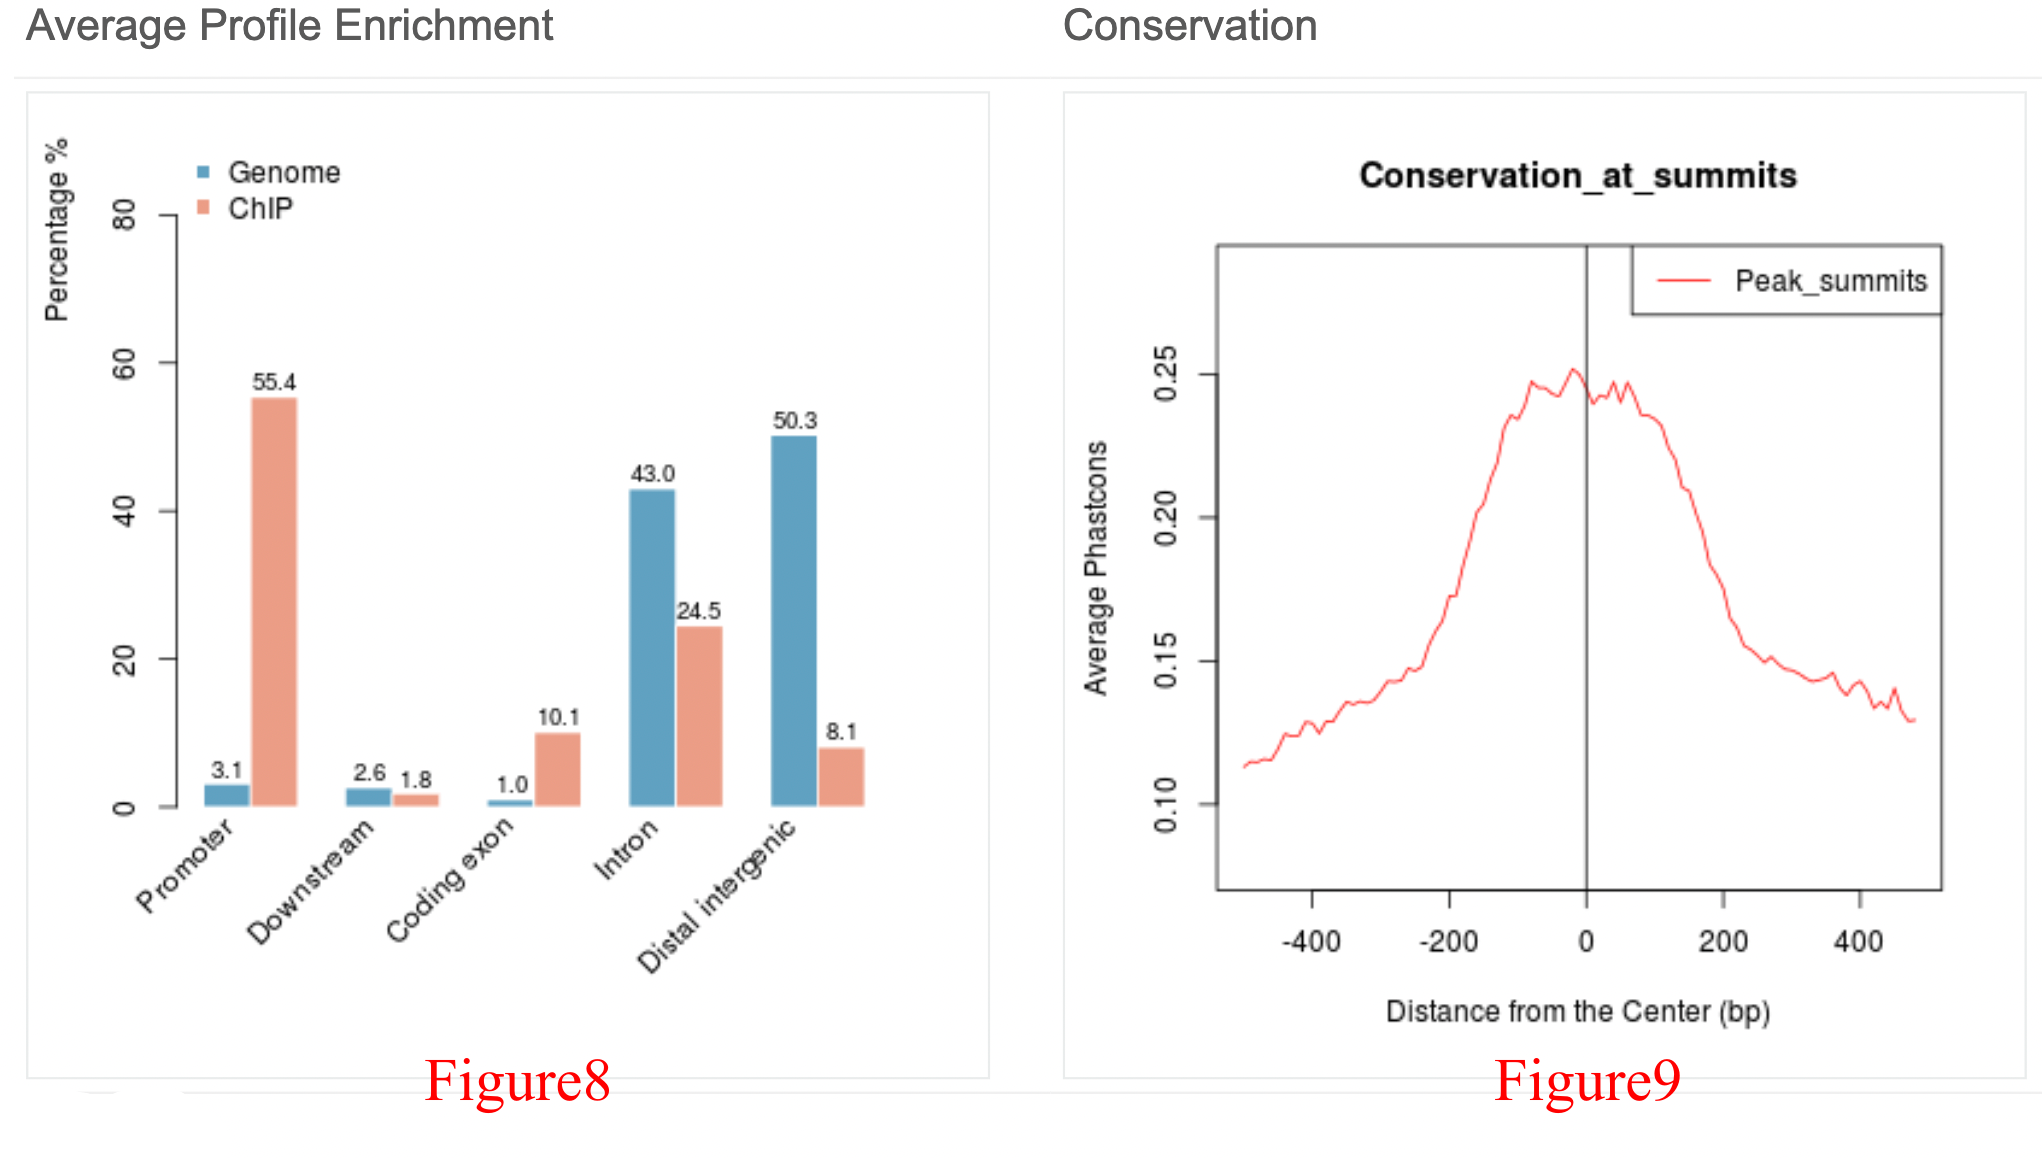
Conserved sequences indicate similar or identical sequences across different species, and highly conserved sequences tend to be biologically functional. Here, we focused on the 500 bp (for broad histone modification peaks, we set it to 2,000 bp) upstream and downstream of the summit of each PHF8 peak, and the peak height was much higher in the middle than the surroundings, indicating that the middle part is more conserved and functional than the surroundings.
Step 3 BACK TO TOP
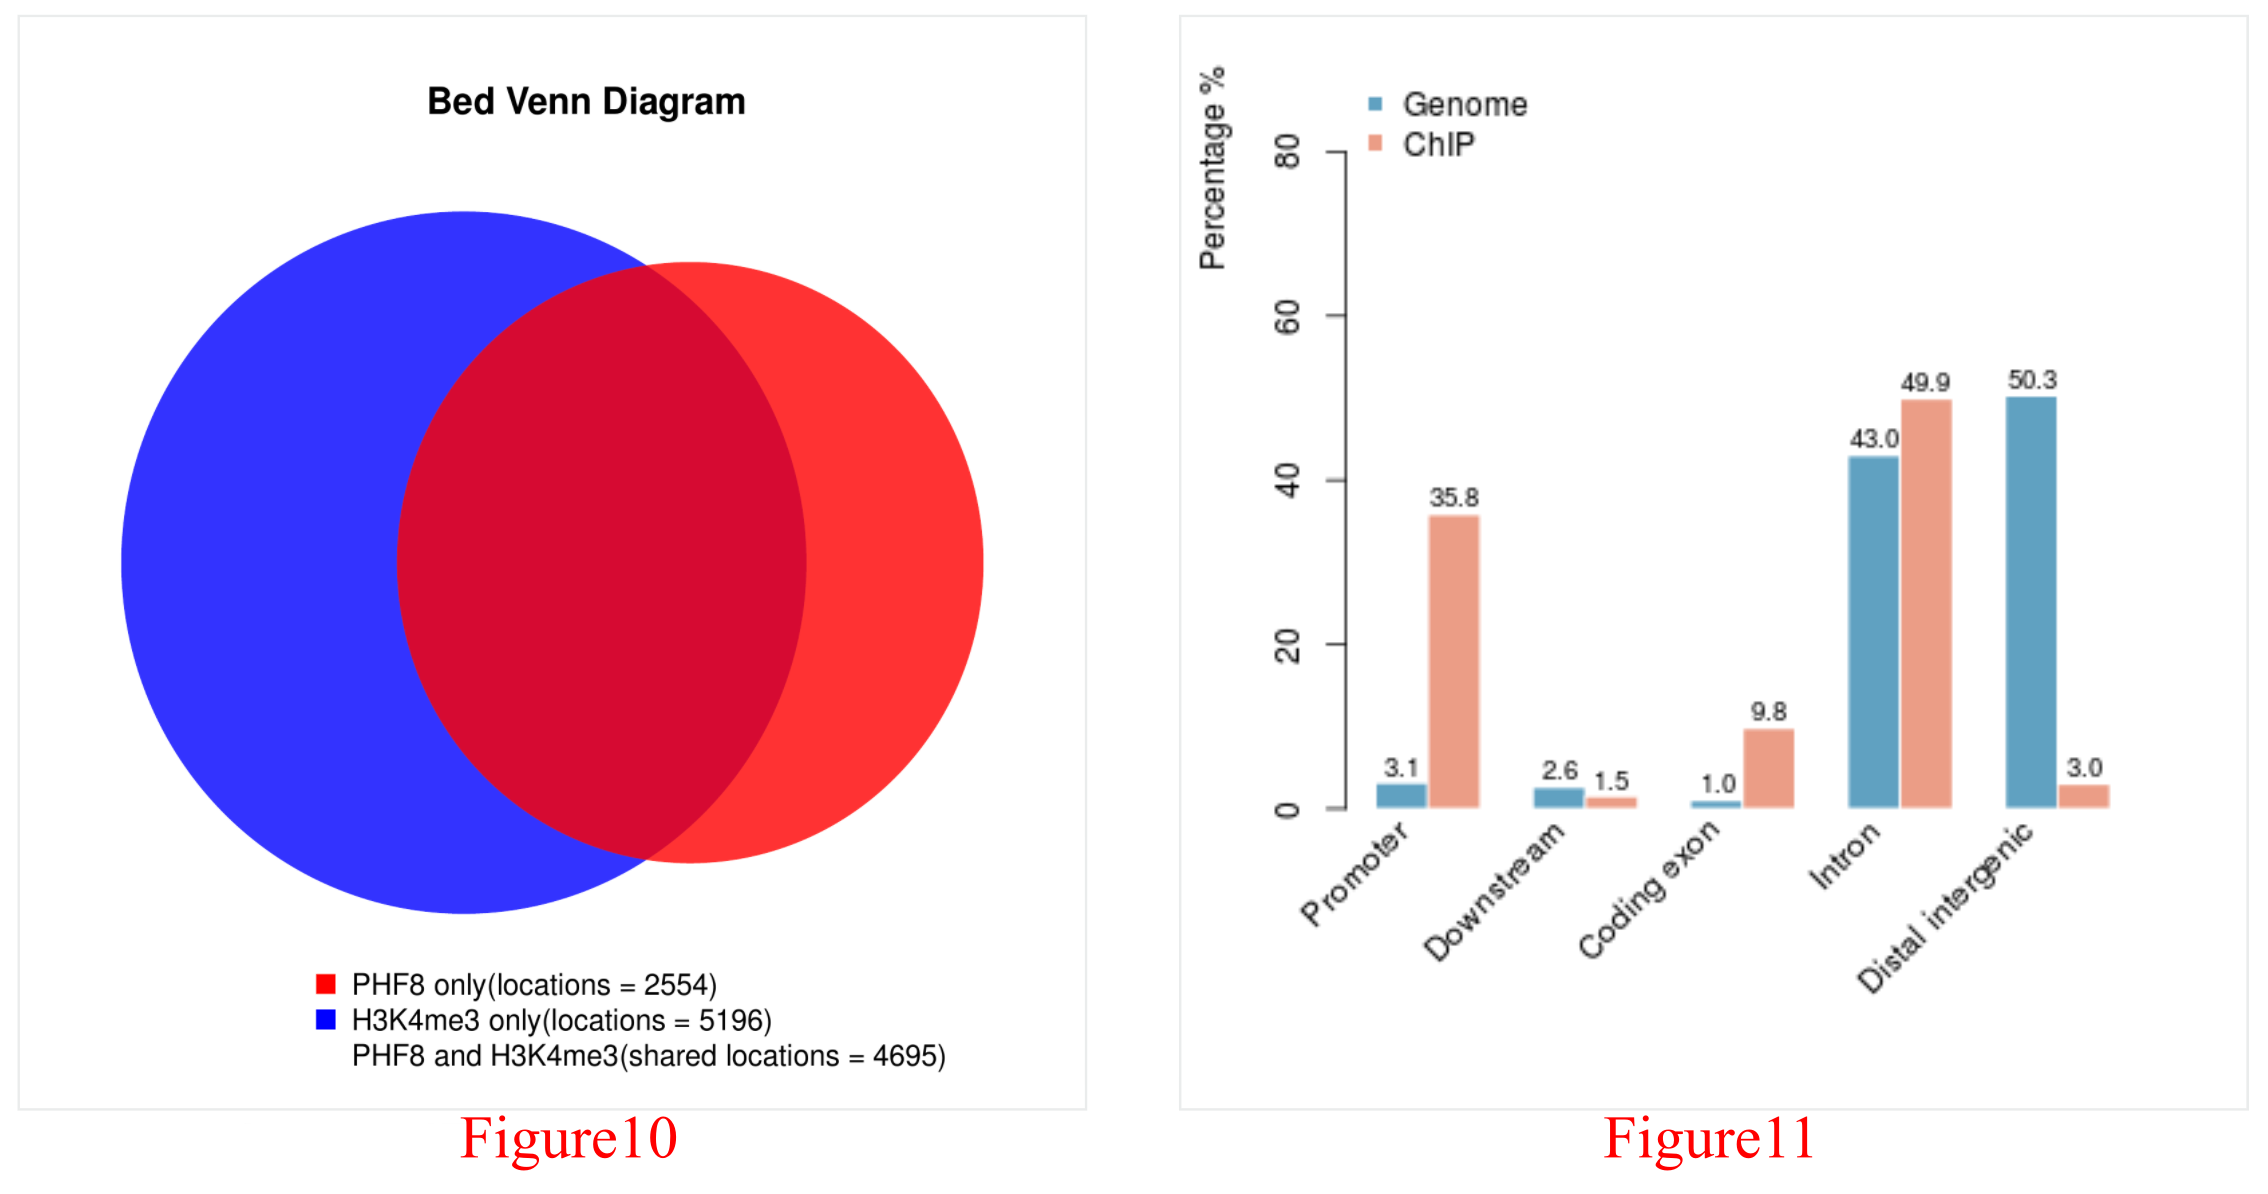
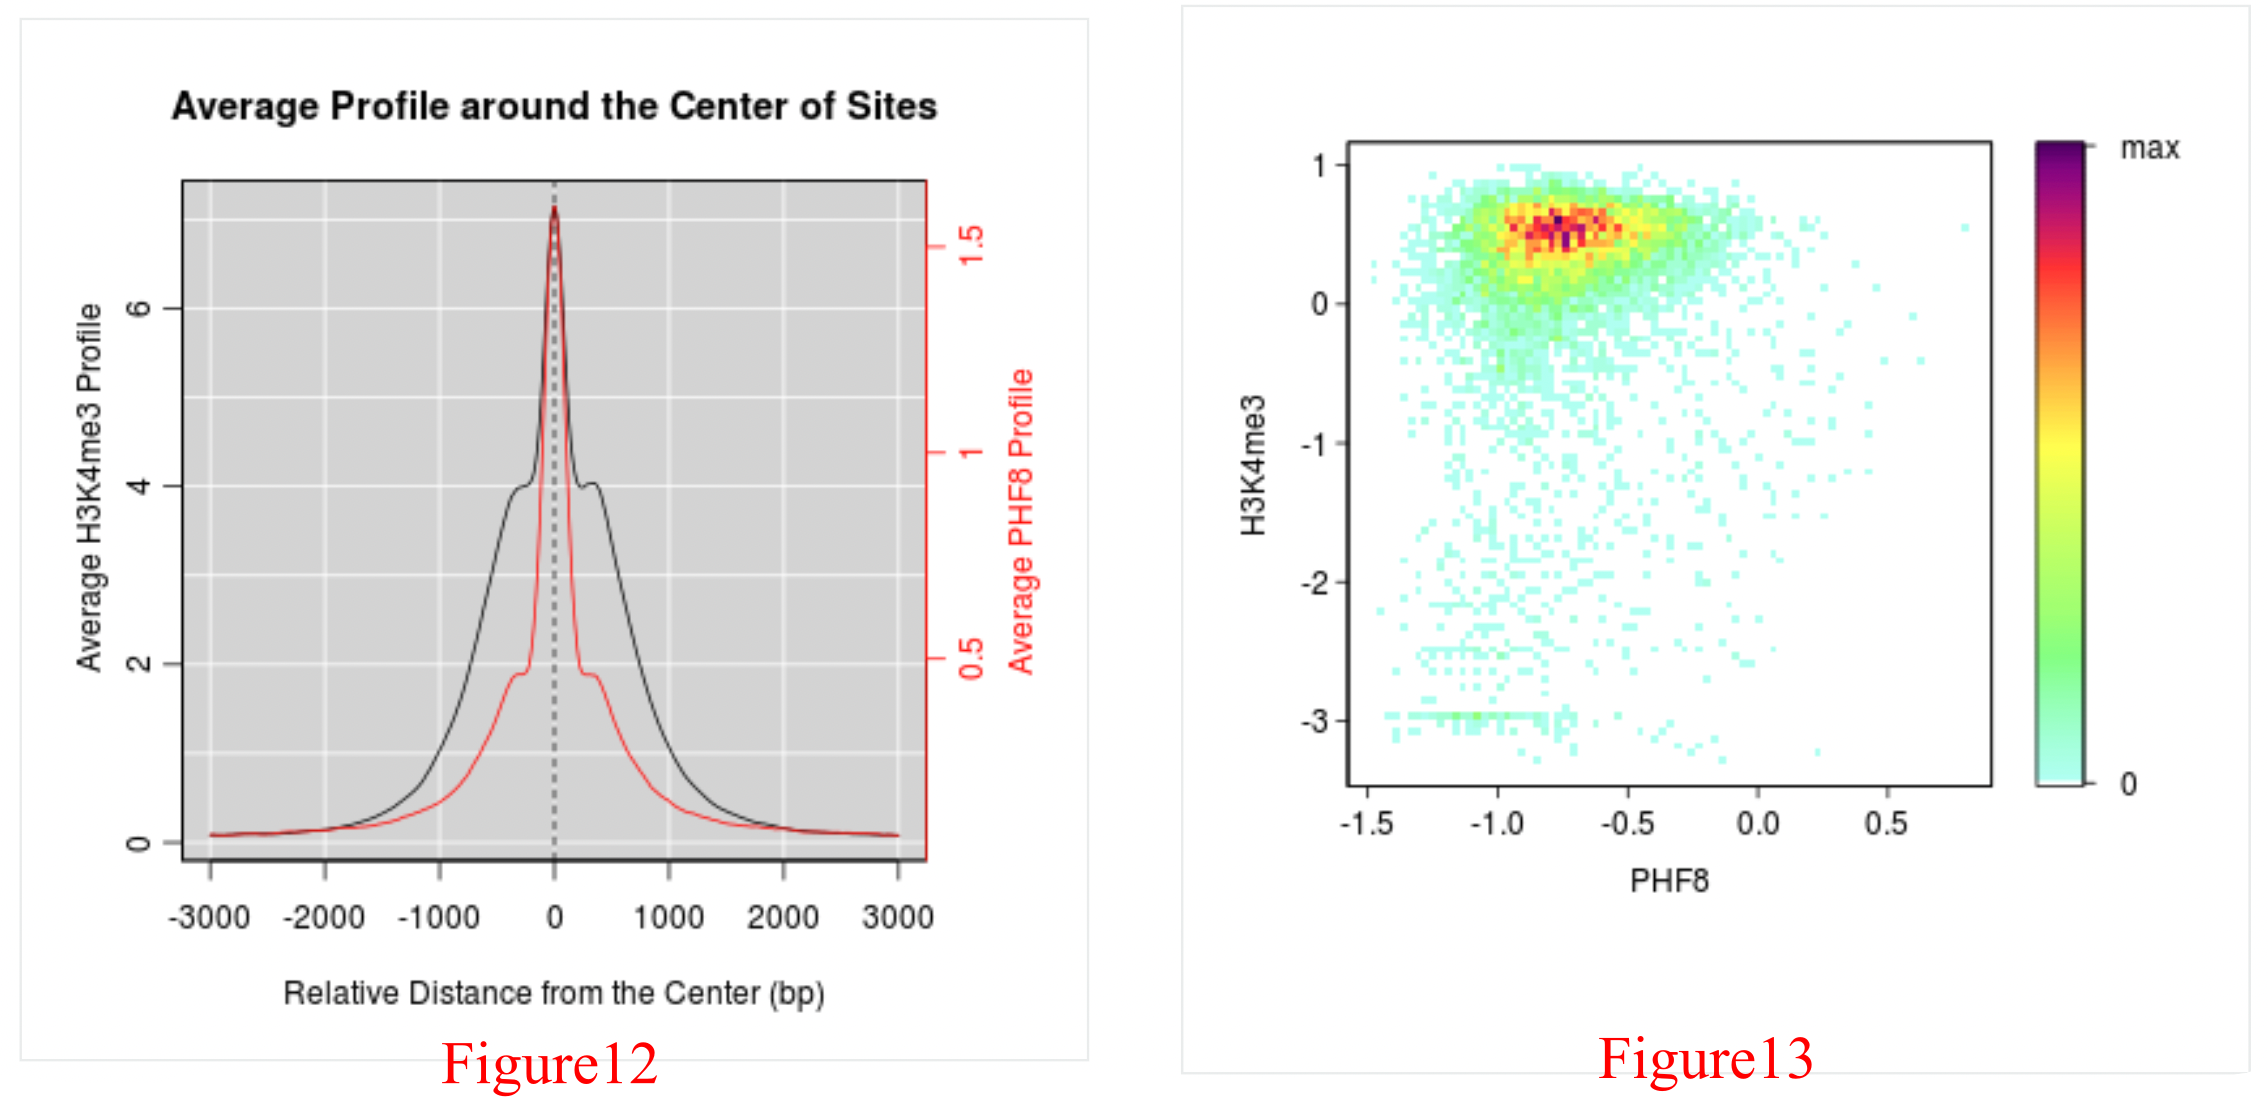
As PHF8 is a reader of H3K4me3, and there are also ChIP-Seq data for H3K4me3 in human fibroblasts, figures representing a detailed analysis between PHF8 and H3K4me3 can be obtained through the green arrow in Figure 2. Here, we list the PHF8 dataset id and H3K4me3 dataset id for each compared pair as well as providing (1) the Venn diagram between PHF8 and H3K4me3 (Figure 10) and the distribution of their overlap peaks (Figure 11), (2) the average PHF8 and H3K4me3 ChIP-Seq signal profile in PHF8's binding sites (Figure 12), and (3) the reads density plot of PHF8 and H3K4me3 in PHF8's binding sites (Figure 13).
The Venn diagram (Figure 10) shows the overlap of the PHF8 and H3K4me3 peaks; the red circle represents all PHF8 peaks; the blue circle represents all H3K4me3 peaks; and the overlap represents the shared peaks between PHF8 and H3K4me3. Here, PHF8 and H3K4me3 overlapped greatly, indicating that they are functionally related.The orange bar of the distribution figure (Figure 11) shows where the overlap peaks in Figure 10 are enriched throughout the genome, while the blue bar shows the distribution generated by chance (If there're no overlap peaks in Figure 10, this figure will be blank). Here, the overlap peaks for PHF8 and H3K4me3 are enriched in the promoter region compared to the by-chance distribution.
The average PHF8 and H3K4me3 ChIP-Seq signal profile observed within the PHF8 peaks (Figure 12) provides the read density of PHF8 and H3K4me3 in the PHF8 peaks. The red line and the right red y-axis stands for PHF8 profile and the black line and black left y-axis reprents H3K4me3 profile. Here, H3K4me3 is enriched within the PHF8 peak summits. The read density plot for PHF8 and H3K4me3 within PHF peaks (Figure 13) also provides the H3K4me3 read density among PHF8 peak regions. It is generated to reflect the reads density of a given histone modification among the binding sites for a given chromatin regulator. Each dot refers to one PHF8-binding site, which has been trimmed to 150 base pairs upstream and downstream of the peak center. The value of X-axis (Y-axis) of each dot stands for PHF8’s (H3K4me3’s) read density in this PHF8 binding site, that is the PHF8 (H3K4me3) ChIP-Seq reads number in this binding site normalized by the binding lenghth (300 bp) and then transformed by using log10. We produced an image scatter plot of two datasets in which the colors indicate the density of the points in the scatter plot. Here, H3K4me3 is enriched in the PHF8 peak regions.
BACK TO TOP
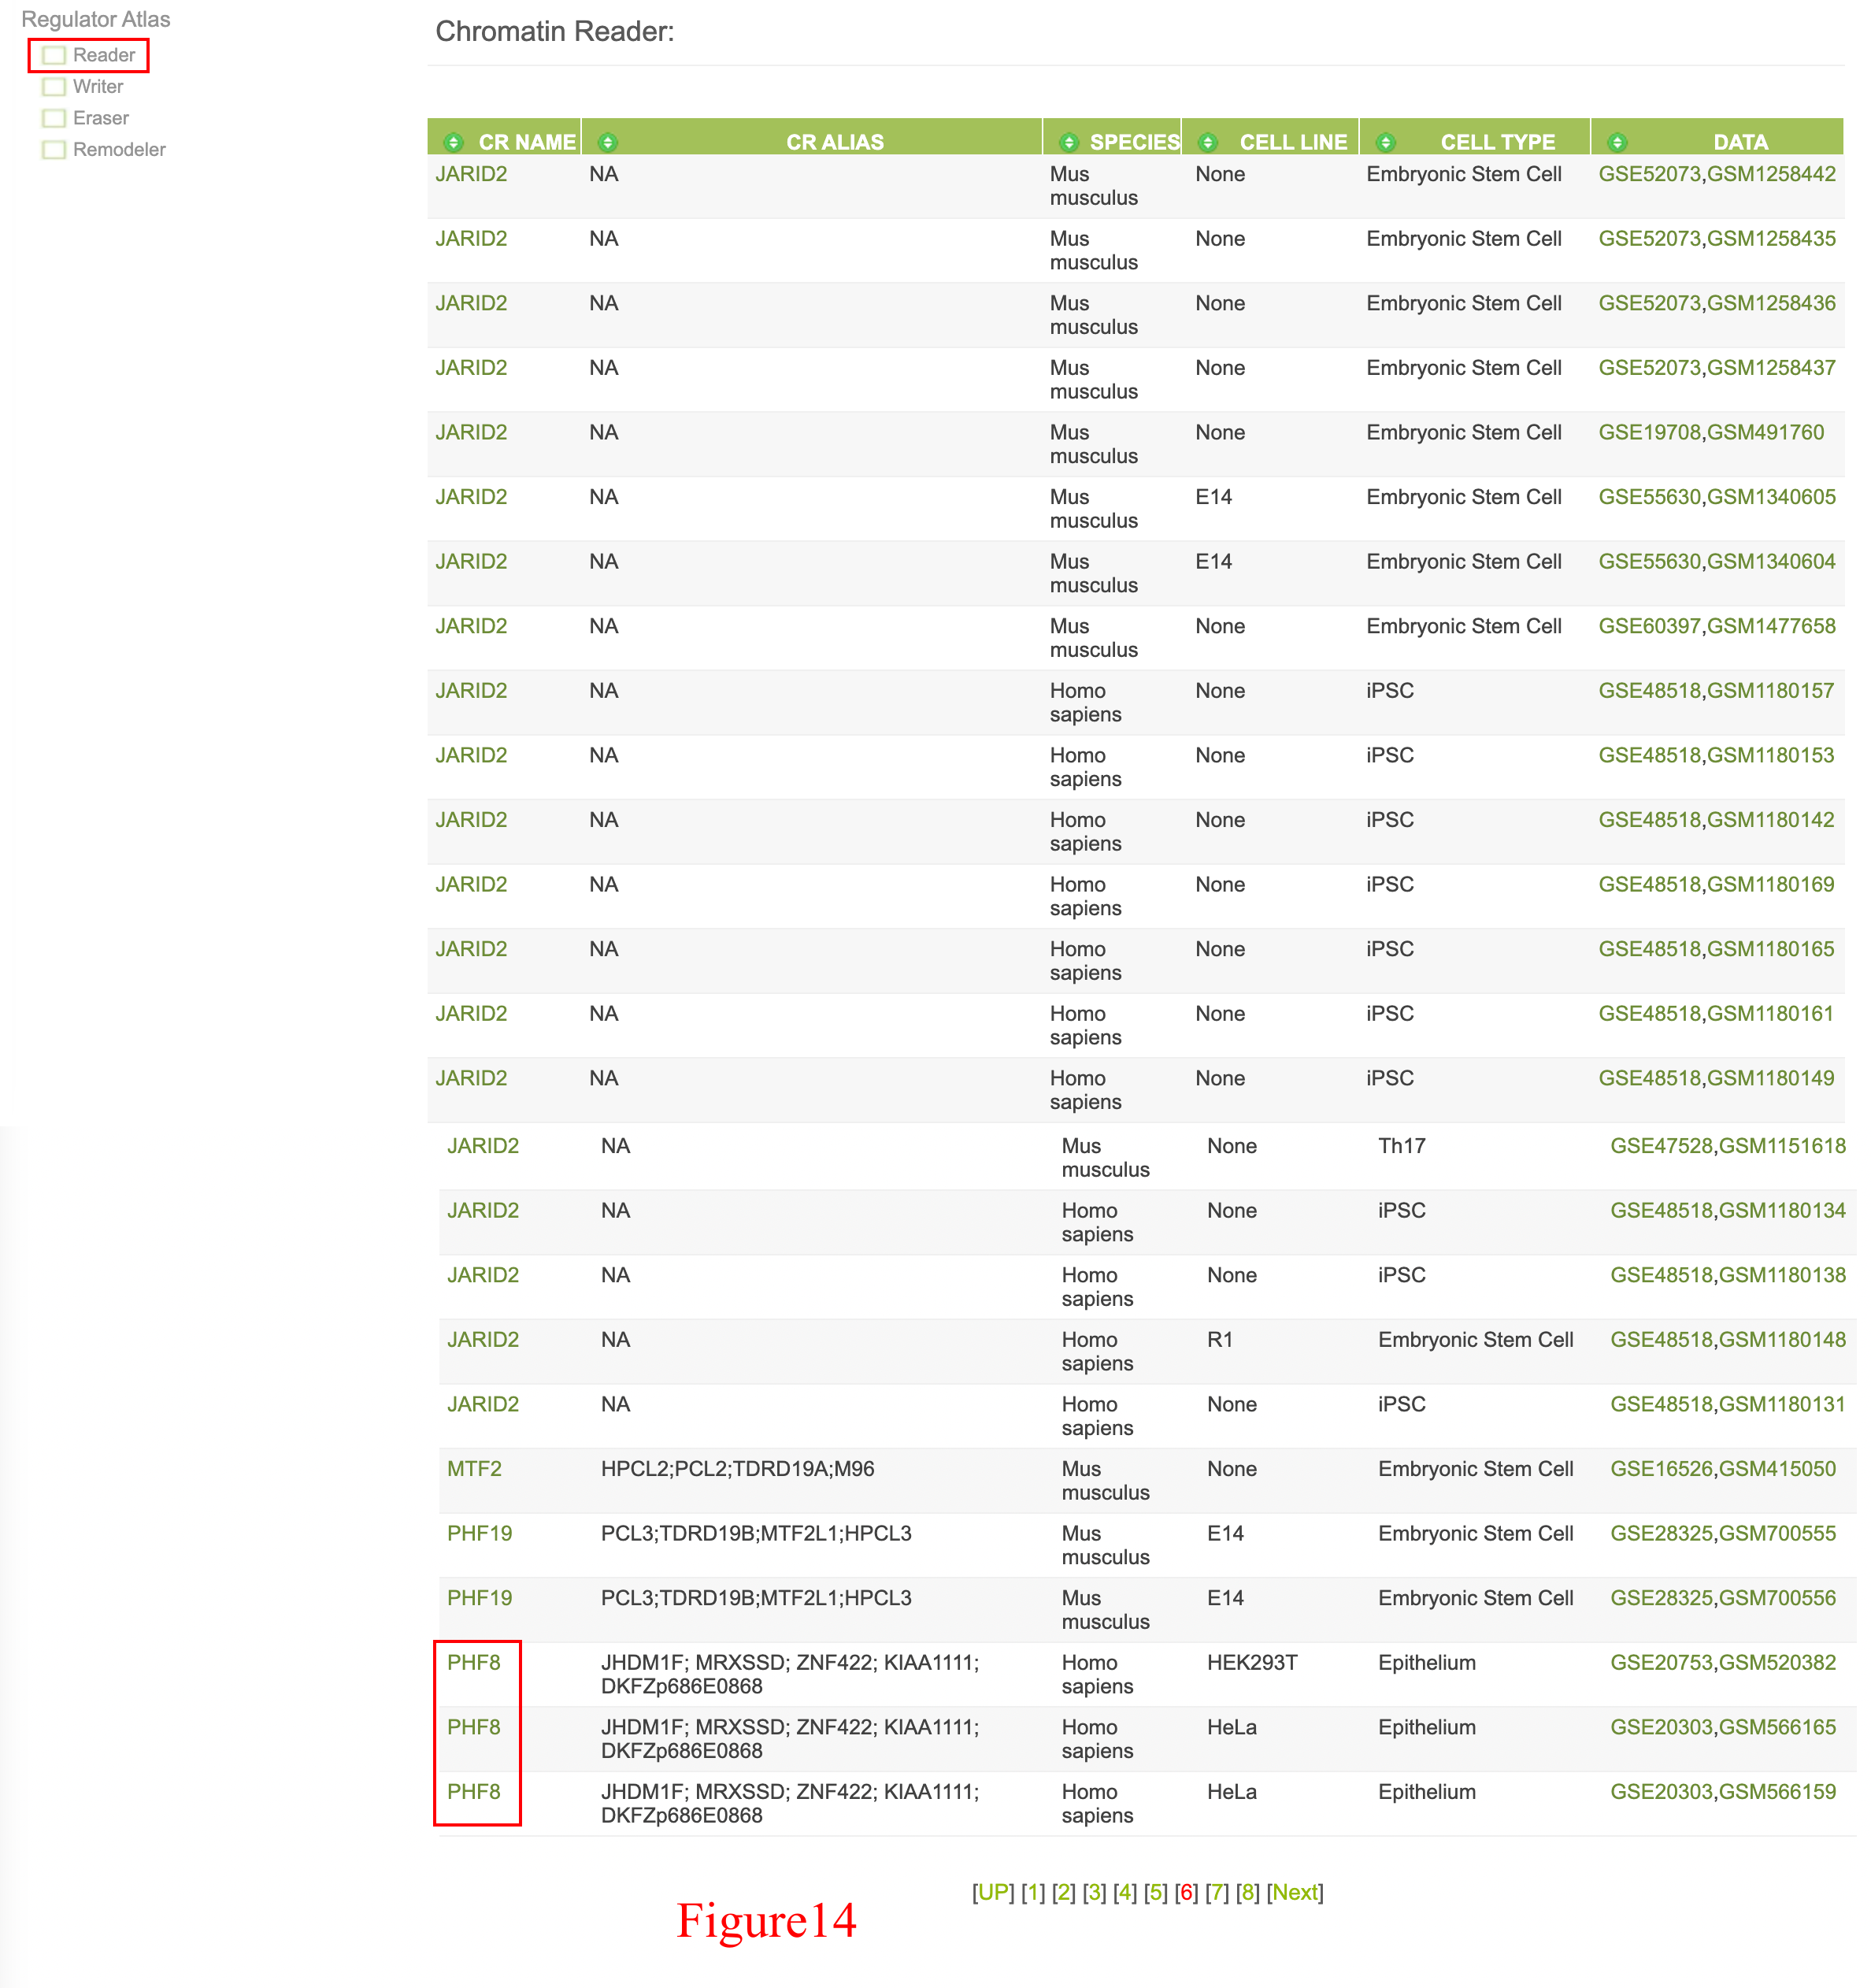
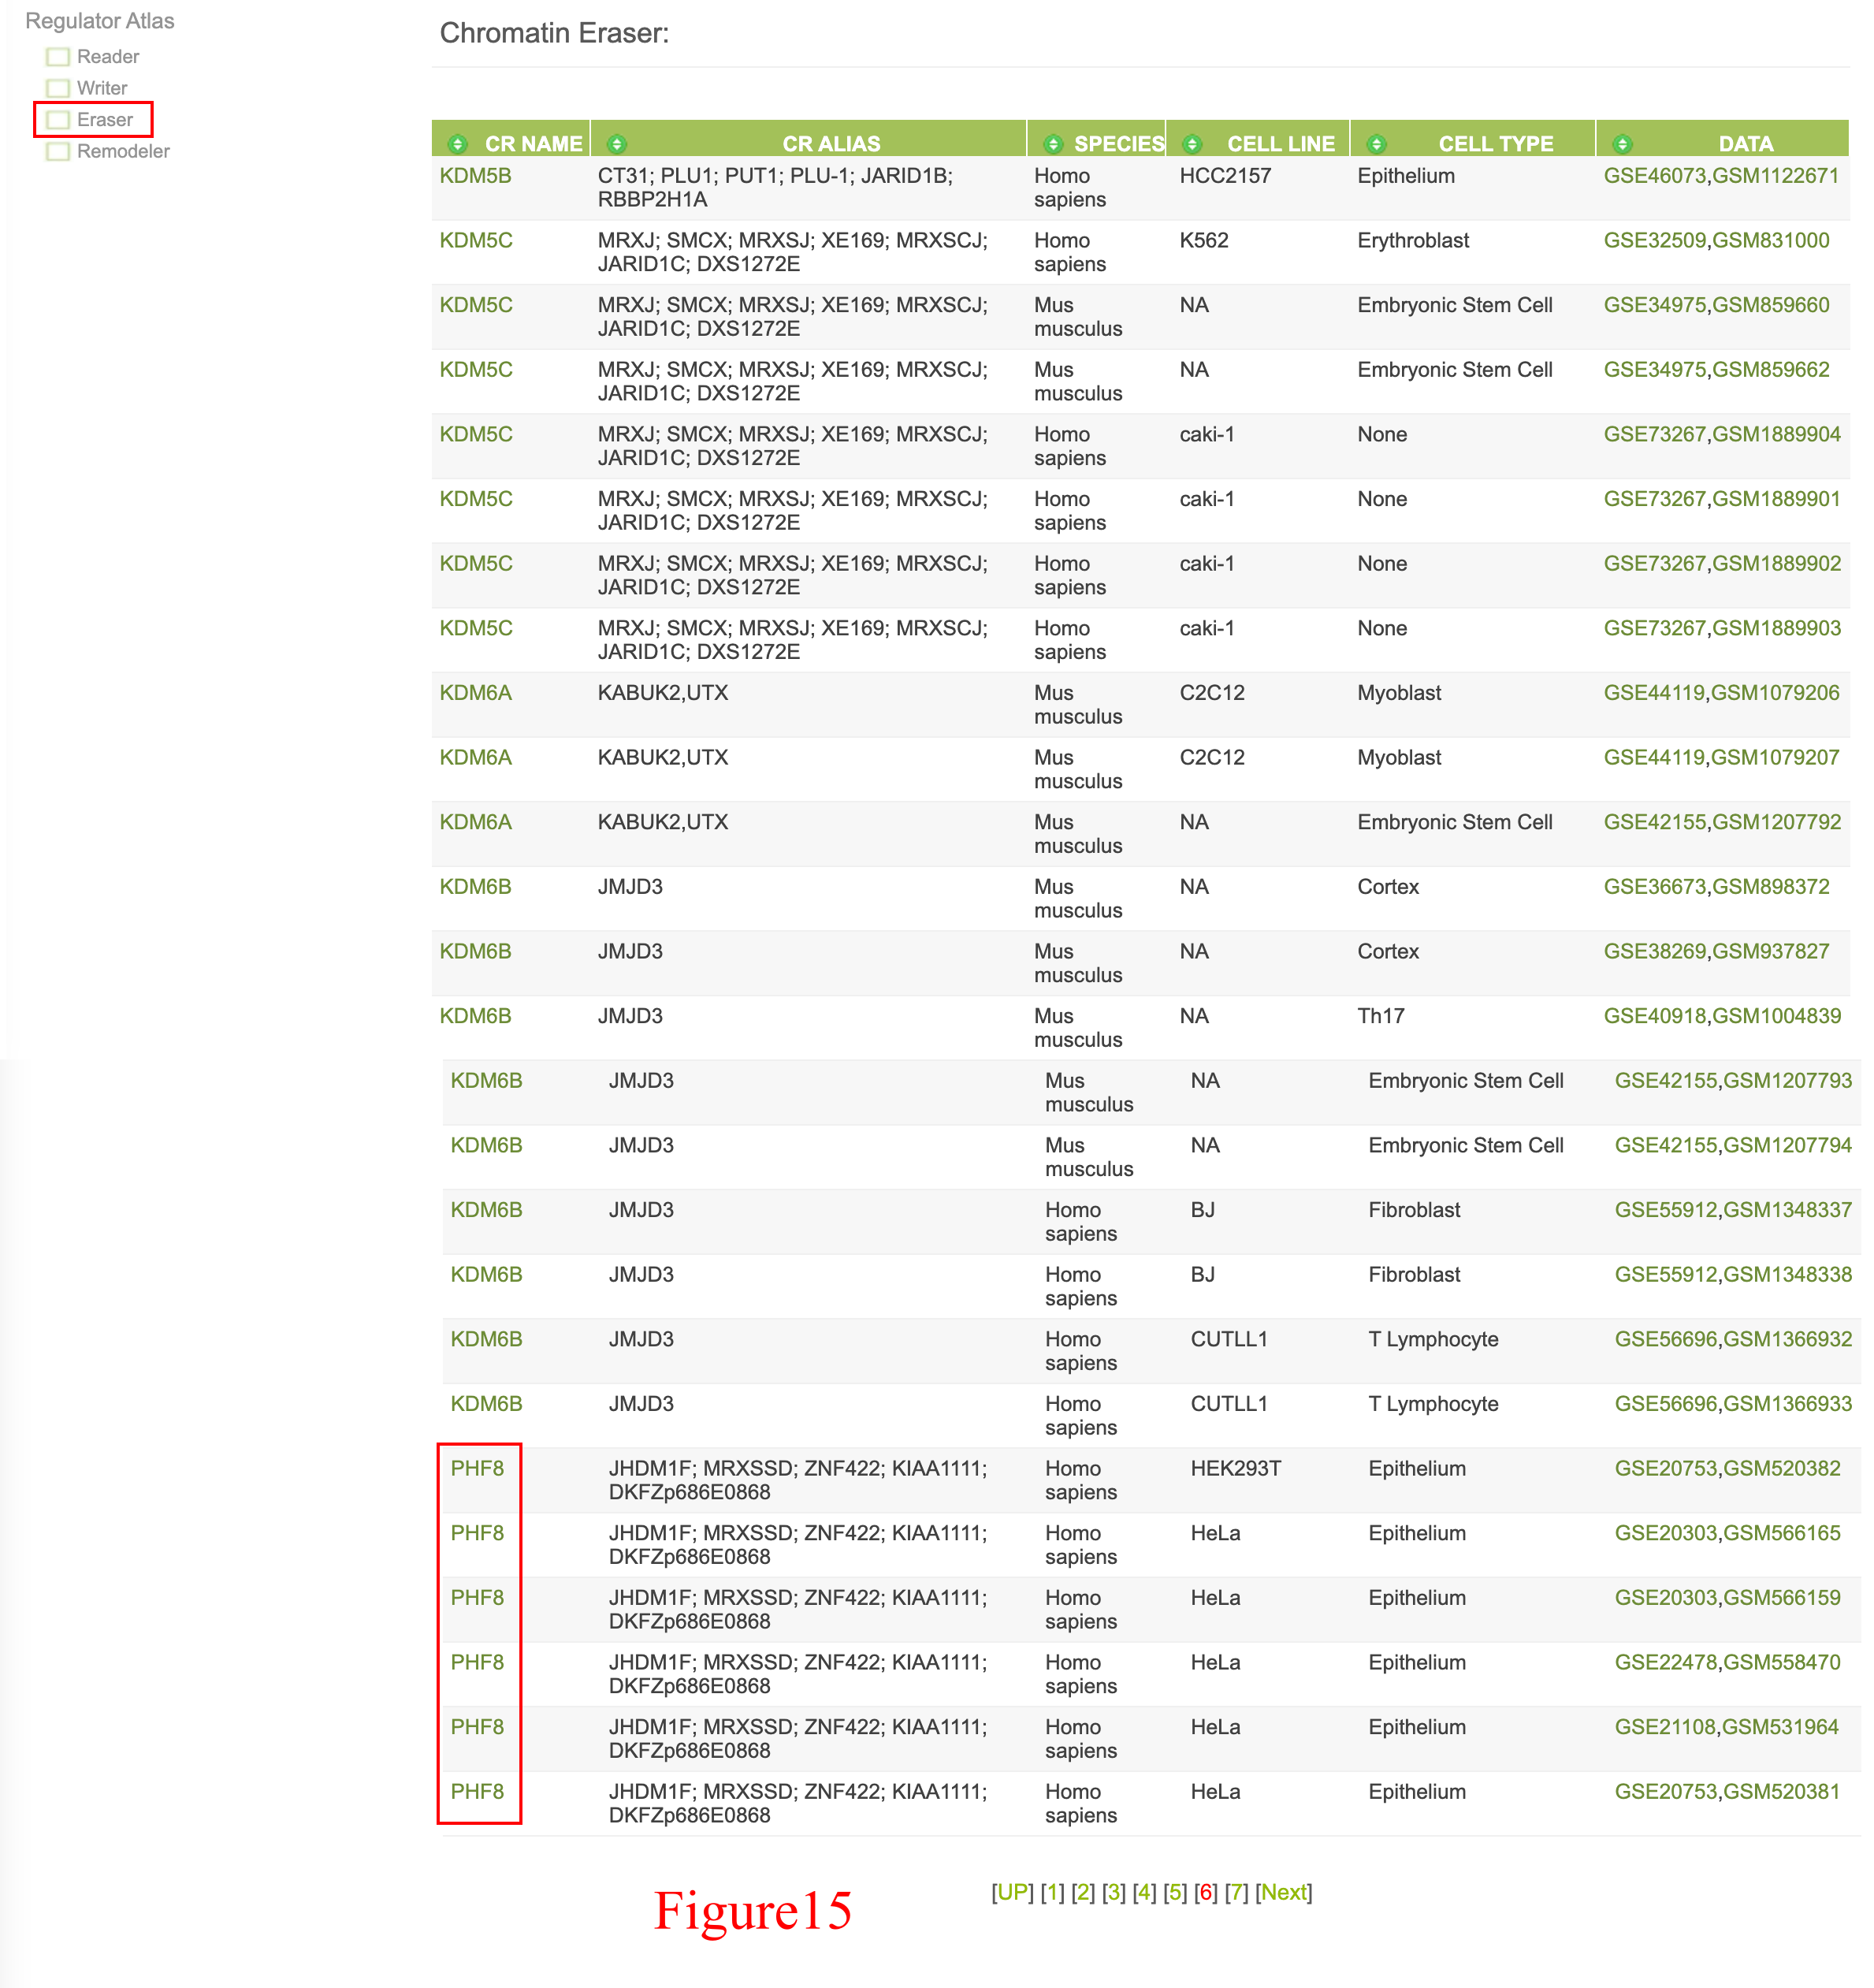
User could also survey ChIP-Seq data dataset by dataset through the left "Regulator Atlias" menu, since PHF8 is a reader and eraser, so user could find PHF8 data in both "Reader" and "Eraser" section (shown in Figure 14 and Figure 15).